Difference between revisions of "GUI"
| Line 52: | Line 52: | ||
2. Connect to the data using the Data Modeler | 2. Connect to the data using the Data Modeler | ||
3. Select how you want to visualize your data | 3. Select how you want to visualize your data | ||
| + | |||
| + | Let's demonstrate this by creating a table | ||
| + | |||
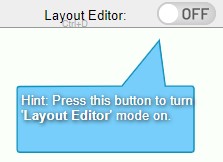
| + | 1. After logging into AMI, enter Layout Editor mode by toggling the Layout Editor mode to ON (found on the upper right corner). Hint: use CTRL + D as a shortcut to quickly go in and out of Editor mode. | ||
| + | |||
| + | [[File:GUI.CreateVisual.01.jpg]] | ||
Revision as of 20:51, 31 March 2021
Getting Started
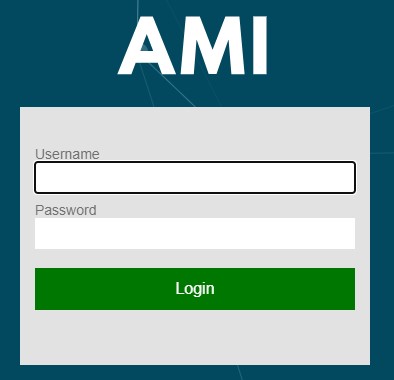
Log into AMI with the provided user name and password (default user/password is demo/demo123)
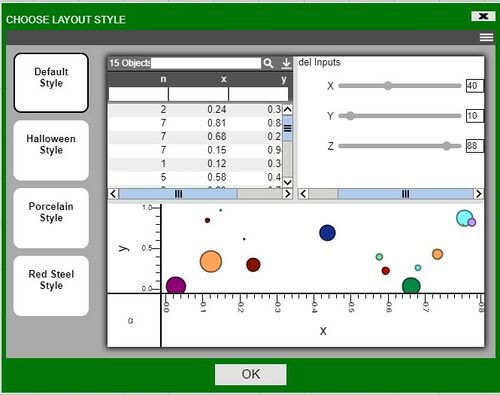
After logging into AMI, choose a layout style (Default Style is shown)
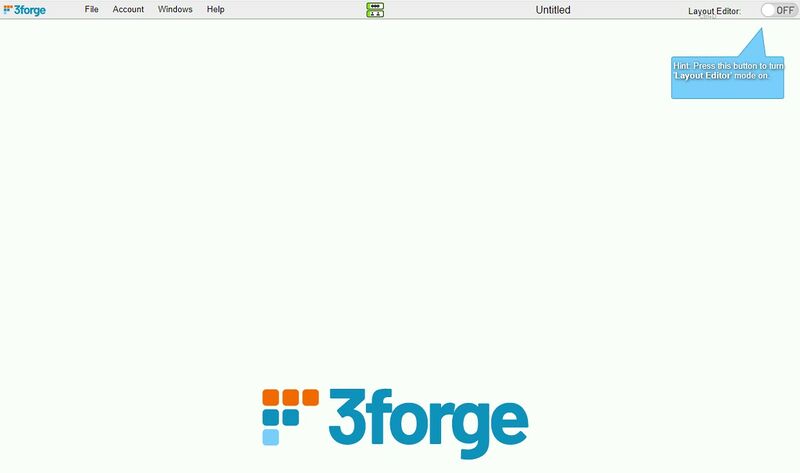
After selecting a style, you will move onto the new dashboard
On the dashboard you will see 1) a Layout Editor toggle button in the upper right corner, 2) a menu bar at the top, and 3) the workbook area below where you add layout components
1. Layout Editor Toggle Button
(Hotkey: CTRL + D)
AMI dashboard builder has two modes. When the Layout Editor is turned on, you have access to tools and functionality for editing the dashboard.
Note: if you do not see the Layout Editor Button, your user account is not entitled for building layouts.
- The Windows menu will have an option to add New Windows and to Manage Windows
- There will be a new Dashboard menu item for accessing tools
- All existing panels will have a green button for accessing that panel's settings
2. The Menu
- File: manage saving and loading of dashboards
- Account: control your personal settings and preferences
- Windows: access, manage, and create windows
- Help: get AMI version, Runtime settings, and list of available script methods, etc.
- Dashboard (in Layout Editor mode): access tools and functionality for building out the dashboard
(Clicking on the 3Forge icon will open up 3Forge's website in a new tab)
3. The Workbook
This is where the dashboard is presented as it is built or loaded
Creating Your First Visualization
Creating a visualization can be summarized into 3 steps:
1. Create a window to put your visualization in 2. Connect to the data using the Data Modeler 3. Select how you want to visualize your data
Let's demonstrate this by creating a table
1. After logging into AMI, enter Layout Editor mode by toggling the Layout Editor mode to ON (found on the upper right corner). Hint: use CTRL + D as a shortcut to quickly go in and out of Editor mode.


