Difference between revisions of "Support FAQ"
(add log viewer doc) |
|||
| Line 1,260: | Line 1,260: | ||
If data type conversion cannot be done then dropping a table from the center would be the last option. | If data type conversion cannot be done then dropping a table from the center would be the last option. | ||
| + | |||
| + | = Logviewer layout = | ||
| + | |||
| + | Here is a layout that reads AMI log files, including '''AmiOne.log''', '''AmiOne.amilog''', to show diagnostic information on AMI's memory usage, timers/triggers/procedures/query performance and more. | ||
| + | |||
| + | [[File:LogViewerV4.txt]] | ||
| + | |||
| + | |||
| + | Instructions: | ||
| + | |||
| + | 1. download and load this layout via File -> Import (copy and paste the text) OR File -> Upload (file) | ||
| + | |||
| + | 2. Go to Dashboard -> Data Modeler | ||
| + | |||
| + | 3. Right click and select Add Datasource, choose Flat File Reader | ||
| + | |||
| + | 4. the Name has to be '''AmiLogFile''' exactly, and give the path to a directory that contains the log files. You can use absolute path or relative path (relative to AMI's root directory) | ||
| + | |||
| + | 5. Click Update Datasource. If successful, it will tell you the number of tables, or files in this case, in the directory. | ||
| + | <br><br> | ||
| + | |||
| + | |||
| + | |||
| + | Using '''AmiOne.amilog''' file to see overall diagnostics on AMI: | ||
| + | |||
| + | 1. In the top left corner, click on the down arrow as seen in the screenshot below. In the drop down, select the .amilog file that you wish to use. | ||
| + | [[File:FileNameArrow.png]] | ||
| + | |||
| + | 2. Feel free to switch between tabs to see different information. You can also adjust the size of the plot/legend by dragging the edge out. | ||
| + | <br><br> | ||
| + | |||
| + | |||
| + | Using '''AmiOne.log''' file to view query performance on AMI: | ||
| + | |||
| + | 1. Go to Windows -> AmiQueriesPerformance | ||
| + | |||
| + | 2. type in the file name that ends in .log, e.g. AmiOne.log | ||
| + | |||
| + | 3. Click on Run Analytics on the right side of the field. | ||
| + | |||
| + | 4. Go to the Performance Charts tab. | ||
| + | |||
| + | 5. You can change the Legends' grouping in the top left panel; filter the chart dots with the bottom left panel. Feel free to sort the table on the bottom panel to suit your needs. | ||
Revision as of 15:48, 3 October 2023
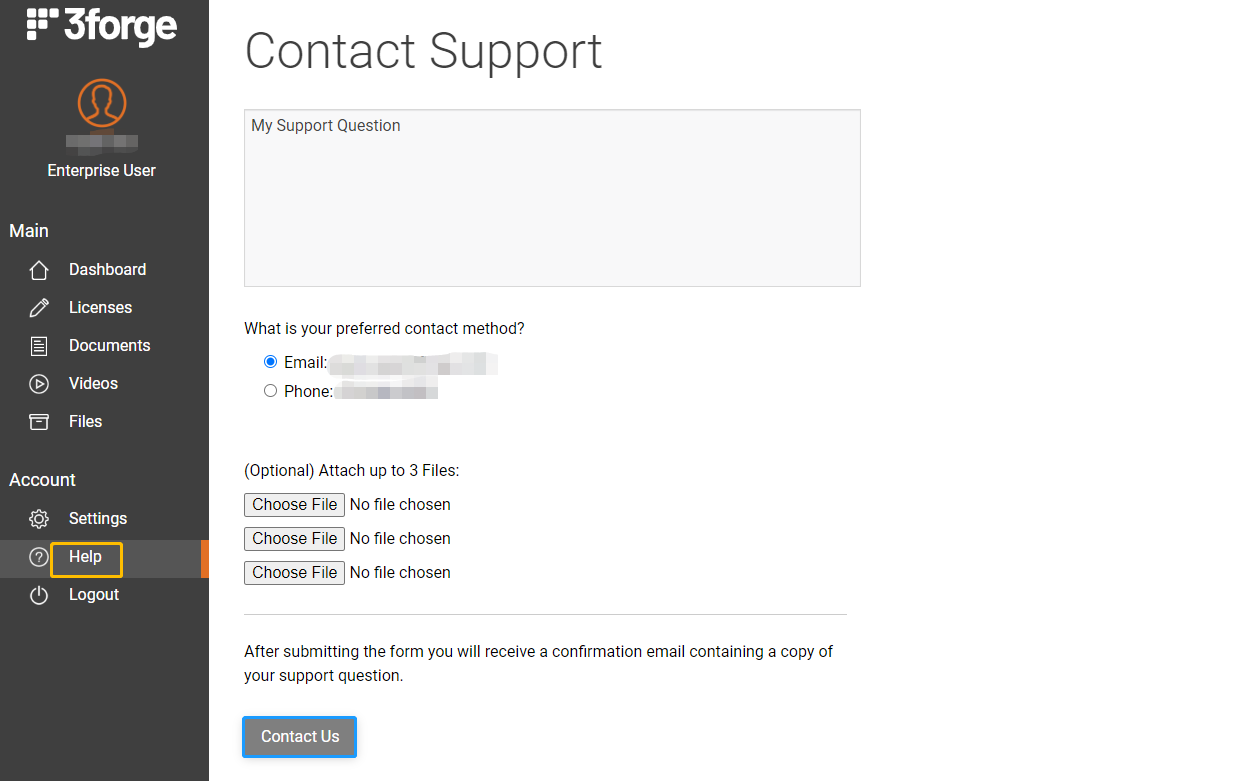
Upload Files and Contact Support From 3forge Portal
Step1: Log in to the account: Log in
Step2: Click Account -> Help, where you can detail your support questions and send attachments to the support team.
Step3: Click Contact Us. The support team will be notified of the support ticket you just created.
Helpful Tricks
Inserting Data from Datamodel to AMI DB
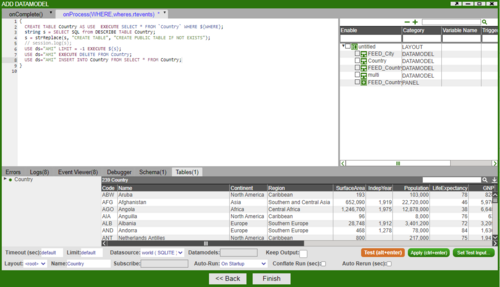
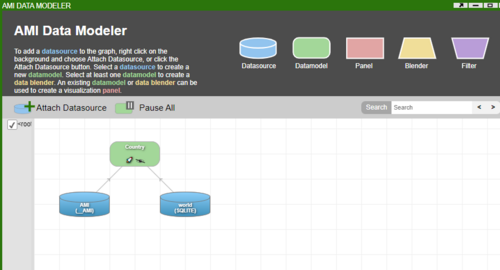
In this example, we will show how to insert data from one datasource to another by using the Datamodel. Here the Country table exists in a datasource called WORLD. We want to take this table and create a copy of it in AMI datasource. To create a copy of the Country table, we need the schema which we get using the DESCRIBE clause.
{
  CREATE TABLE Country AS USE  EXECUTE SELECT * FROM `Country` WHERE ${WHERE};
  string s = SELECT SQL from DESCRIBE TABLE Country;
  s = strReplace(s, "CREATE TABLE", "CREATE PUBLIC TABLE IF NOT EXISTS");
  // session.log(s);
  USE ds="AMI" LIMIT = -1 EXECUTE ${s};
  // USE ds="AMI" EXECUTE DELETE FROM Country;
  USE ds="AMI" INSERT INTO Country FROM SELECT * FROM Country;
}
Firstly, create a Datamodel that is attached to the WORLD Datasource. Copy and paste the above script and run.
This will now give you the Country table in the AMI datasource.
String Template (and Procedures)
For this example we will only use the back-end. First let us create a simple table and add 4 values to it:
CREATE PUBLIC TABLE A (ID String, Price Double);
INSERT INTO A VALUES ("I001",100),("I002",200),("I003",300),("I004",400);
This gives us the following table:
SELECT * FROM A;
| ID
String |
Price
Double |
|---|---|
| I001 | 100 |
| I002 | 200 |
| I003 | 300 |
| I004 | 400 |
Now let's create a string and assign A to it:
String T = "A";
Try running the following script:
SELECT * FROM ${T};
This produces an error as string_template=off.
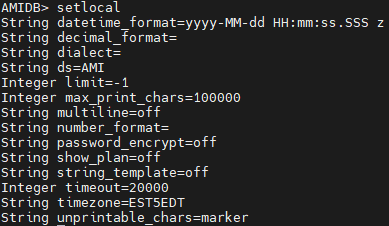
Let's set string_template=on. Note we find string_template under the setlocal command:
To set this to 'on' run the following:
setlocal string_template=on;
Try running the following script again:
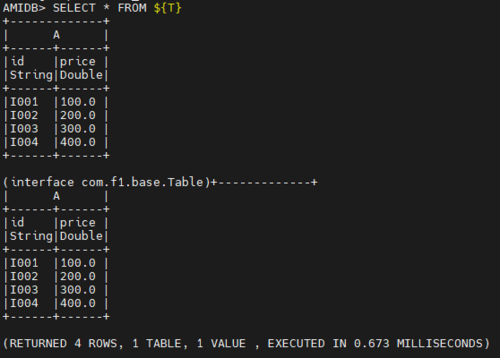
SELECT * FROM ${T};
This will now output table A.
Using PROCEDURES
Let's roll back and set string_template=off. This time we will create the following PROCEDURE:
CREATE PROCEDURE testProc OFTYPE AMISCRIPT USE arguments="String T" script="Int n = 2; Table t = SELECT * FROM ${T} LIMIT n; SELECT * FROM t;";
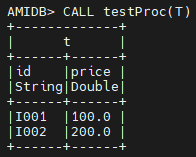
and then call the procedure as such:
CALL testProc(T);
Copying Style from one Dashboard to Another
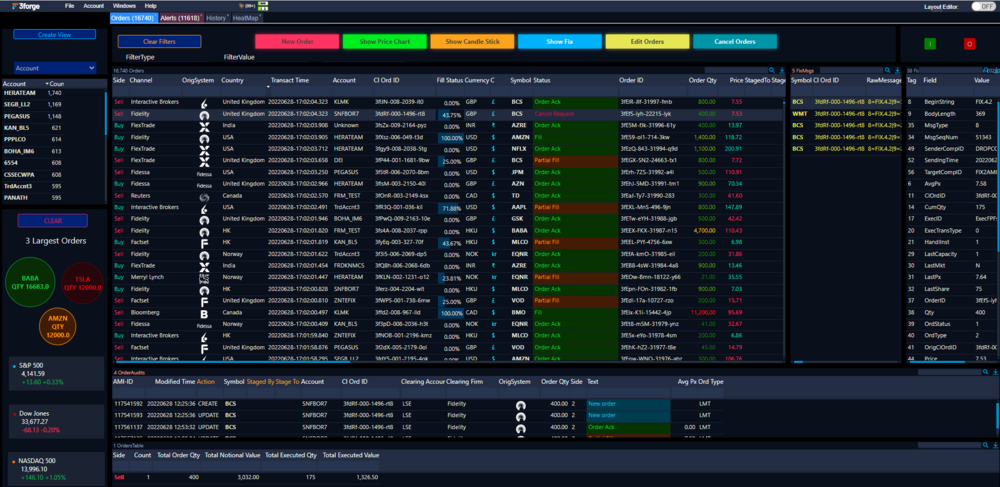
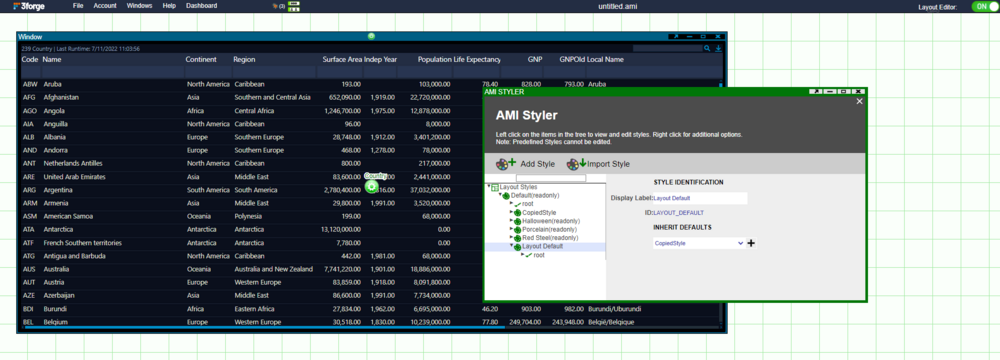
To copy a dashboard style from one dashboard to another we can use the Import/Export Style function in Style Manager. Let's take a pre-styled dashboard as such:
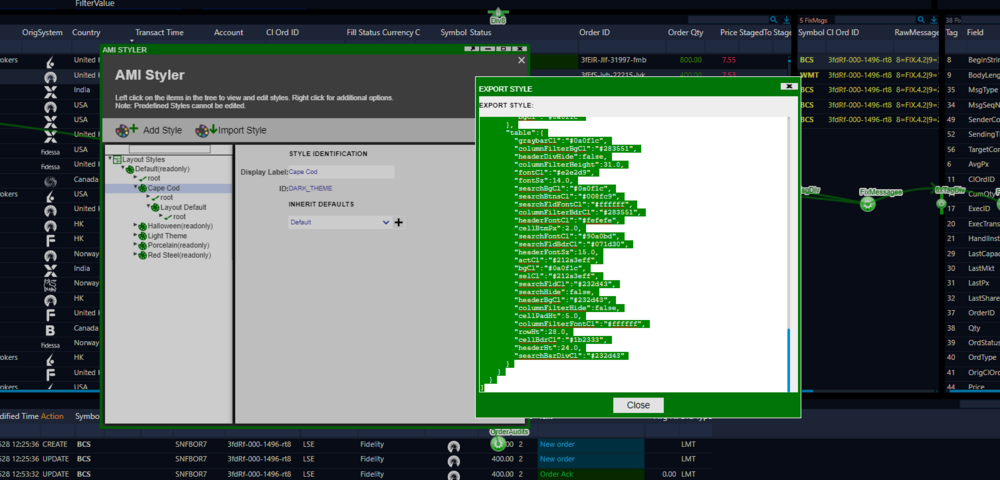
To copy this style, enter Development mode and under Dashboard select Style Manager. Select the style to copy, right click to Export Style and copy:
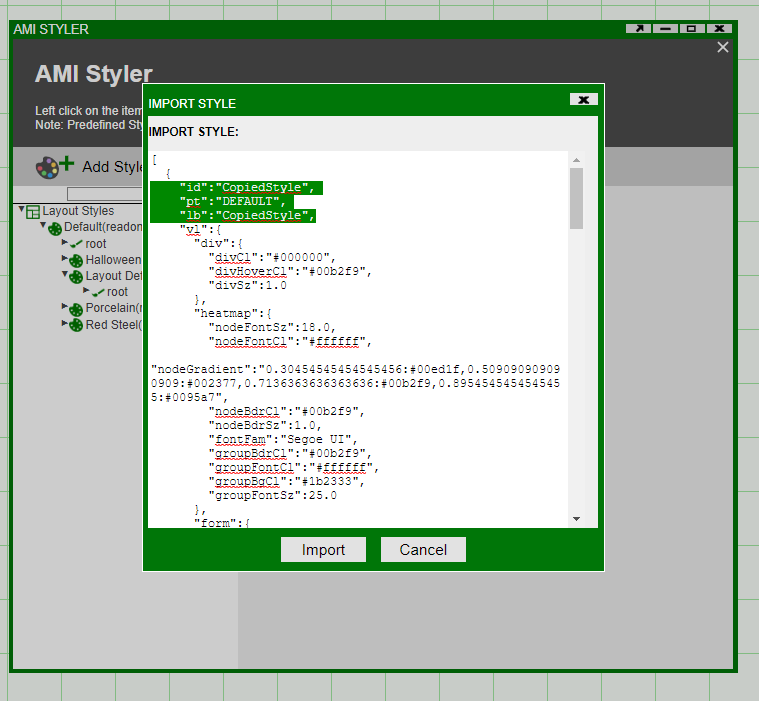
Next, open the dashboard in which you would like to import this style. Under Style Manager select Import Style. Paste the copied text - you can rename the id and lb to your preferred names (here we have named both to CopiedStyle):
Finally, under Layout Default, select CopiedStyle to inherit from. This will update the style of the entire dashboard to this style.
Charts
Plotting Bar Chart Side-by-Side
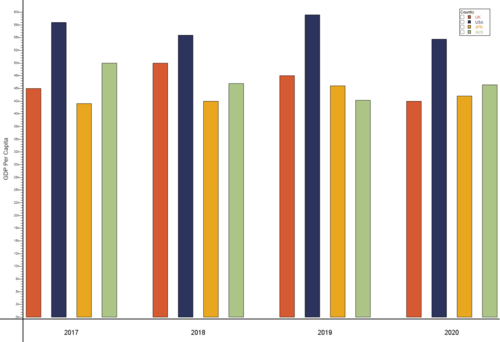
In this example, we will be plotting a grouped bar chart to show the GDP per capita for UK, USA, JPN and AUS between 2017 and 2020. The result looks as such:
To start off with, create a Datamodel with the code snippet below. Once we have a table with our data, in this case GDPPerCapita table we need to prepare the dataset to plot the data. The following code snippet prepares the data by creating a table called GDPPerCapitaPlot.
{
 create table GDPPerCapita (Year string, UK double, USA double, JPN double, AUS double);
 insert into GDPPerCapita values ("2017", 45000, 58000, 42000, 50000);
 insert into GDPPerCapita values ("2018", 50000, 55500, 42500, 46000);
 insert into GDPPerCapita values ("2019", 47500, 59500, 45500, 42700);
 insert into GDPPerCapita values ("2020", 42500, 54700, 43500, 45700);

 Table t = select * from GDPPerCapita;
 List yearList = select Year from GDPPerCapita;
 List valTypesList = t.getColumnNames();
 valTypesList.remove(t.getColumnLocation("Year"));

 create table GDPPerCapitaPlot (Year string, valType string, x double, val double);

 int n = 1;
 for (int i = 0; i < yearList.size(); i++) {
    Row r = t.getRow(i);
    string Year = r.get("Year");
    double ld = 0.0;
    int cnt = 0;
    for (string valType : valTypesList) {
      double val = r.get(valType);
      insert into GDPPerCapitaPlot values (Year, valType, n, val);
      ld += n;
      n += 1;
      cnt += 1;
    }
    ld = ld / cnt;
    insert into GDPPerCapitaPlot values (Year, "label", ld, 1.0);
    n+=1;
  }
}
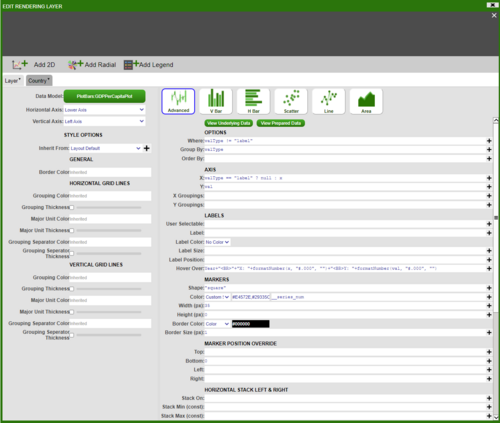
Next, we will add a visualisation to the Datamodel on the GDPPerCapitaPlot table. Choose the ‘2D Chart’ – ‘Advanced’, and fill in the options as below (For ‘Color’ in ‘MARKERS’ section choose Custom_Series and add series of colours in hex code for example ‘#E4572E,#29335C,#F3A712,#A8C686,#669BBC’):
NB. Make sure the options under Marker Position Override are filled in as shown.
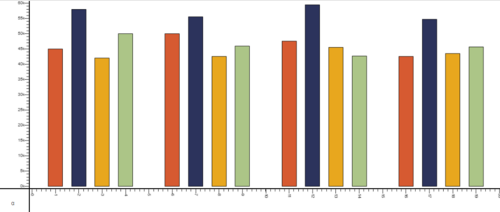
This will give us the following bar plot:
To add axis and get the final result, add a panel below the bar chart, then add a visualisation based on GDPPerCapitaPlot table with the following information:
Editing and styling the axis and the divider gives us the desired chart.
Plotting Multiple Line Graphs on Same Panel
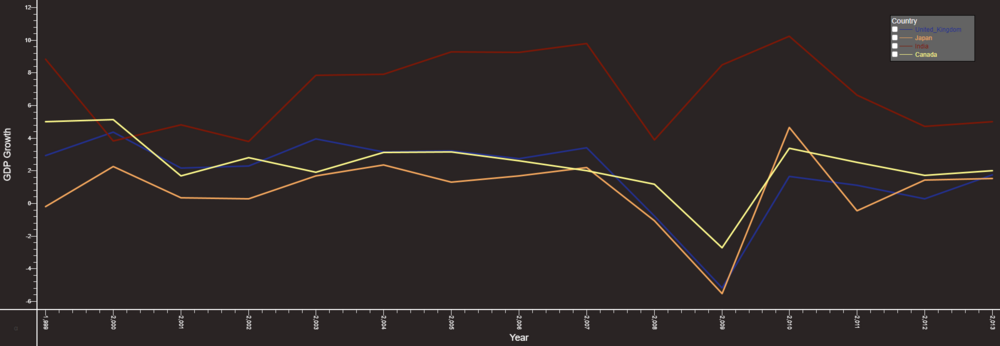
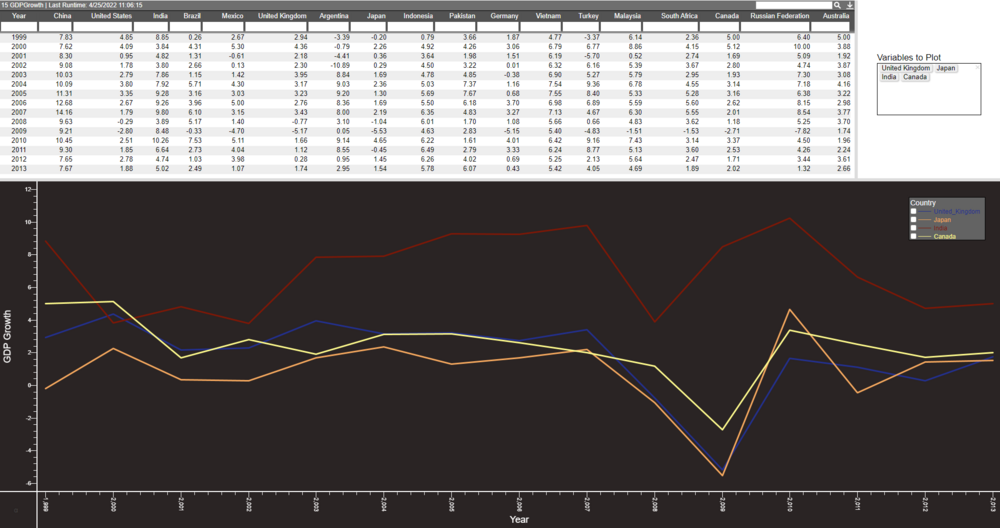
In this example we will show how to plot multiple line graphs on the same chart panel. We will use a sample dataset that shows the GDP Growth of several countries:
Output will look as such:
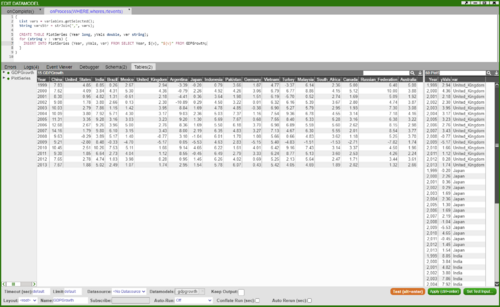
The method we will follow is similar to the one before. Firstly, we want to be able to choose the countries we plot, so we will create a HTML panel with a 'Multiple Checkbox' field called 'variables'. Once we have this field set up, insert the following snippet into a Datamodel.
{
  List vars = variables.getSelected();
  String varsStr = strJoin(",", vars);

  CREATE TABLE PlotSeries (Year long, yVals double, var string);
  for (string v : vars) {
    INSERT INTO PlotSeries (Year, yVals, var) FROM SELECT Year, ${v}, "${v}" FROM GDPGrowth;
  }
}
This creates a table PlotSeries which will be used to plot the graph:
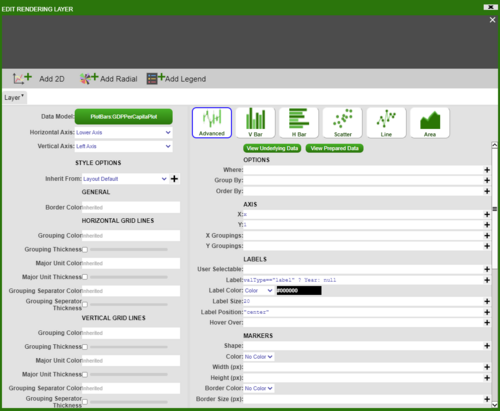
Next create a visualisation on the Datamodel from above using the PlotSeries table and choose '2D Chart' - 'Advanced'. We will add 'Year' on the X-axis and 'yVals' on the Y-axis. We want to group the data by the Countries so add 'vars' in the 'Group By' option. Finally, we want to have the lines for each country represented by a different colour - in the 'Line Colour' option choose 'Series' (to get predetermined colours) or 'Custom Series' (to choose custom colours) and __series_num:
Dynamic Aggregation on Visible Columns
In this example we go through the steps showing how a user can use visible columns to drive aggregate columns. This is done by getting the visible columns and using the column names to drive a new query whenever the columns are hidden or shown.
We start by creating a datamodel named Orders that produces the Orders table with the following data:
{
  CREATE TABLE Orders(ID int, Country string, Size long, Price double, OrdType string, Side string);
  INSERT INTO Orders Values(1,"HK",5000,3.00,"1","B"), (2,"HK",3000,5.00,"2","B"), (3,"CH",2000,6.00,"1","B"), (4,"CH",1500,8.00,"2","S");
}
Next, create a blender named OrdersGroupBy on the above datamodel. We need to add and access an argument called groupByClause which will be passed into this blender and will store the column names that drive the aggregation. This argument can be accessed from the wheres map passed into onProcess(WHERE,wheres,rtevents).
Our argument groupByClause can be accessed like so:
String groupByClause = wheres.get("groupByClause");
Use the following code to produce a new table that will have some aggregate columns, in this example we have a column that sums all of the sizes and a column that gives the average price.
We want to add some conditions using an if statement, this is where we make use of the ‘groupByClause’ we defined previously. Since this argument will contain the column names that drive the aggregation we want to make sure that a table is still created even if the argument is empty. We do this by adding a condition to create a table from our existing columns if no new column is provided.
If we are given a new column name we add this to a select statement. We add the column name both in the select portion and then at the end to group the results of the query.
{
  CREATE TABLE Orders AS SELECT * FROM Orders WHERE ${WHERE};

  String groupByClause = wheres.get("groupByClause");

   if (groupByClause == null || groupByClause == "") {
    groupByClause = "Country, OrdType, Side";
    create table OrdersGroupBy as select ${groupByClause}, sum(Size), avg(Price) from Orders group by ${groupByClause};
    // create table OrdersGroupBy as select sum(Size), avg(Price) from Orders;
  }
  else {
    create table OrdersGroupBy as select ${groupByClause}, sum(Size), avg(Price) from Orders group by ${groupByClause};
  }
}
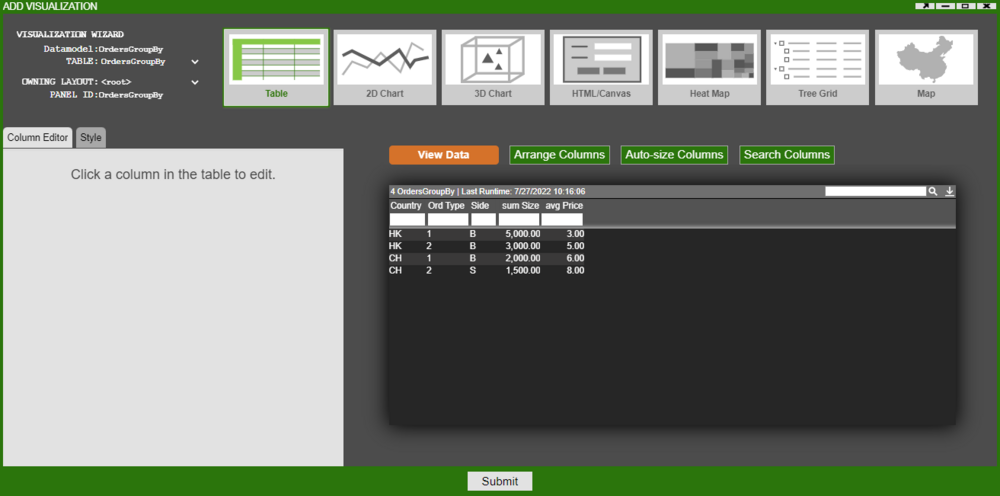
Next, create a visualization for OrdersGroupBy table.
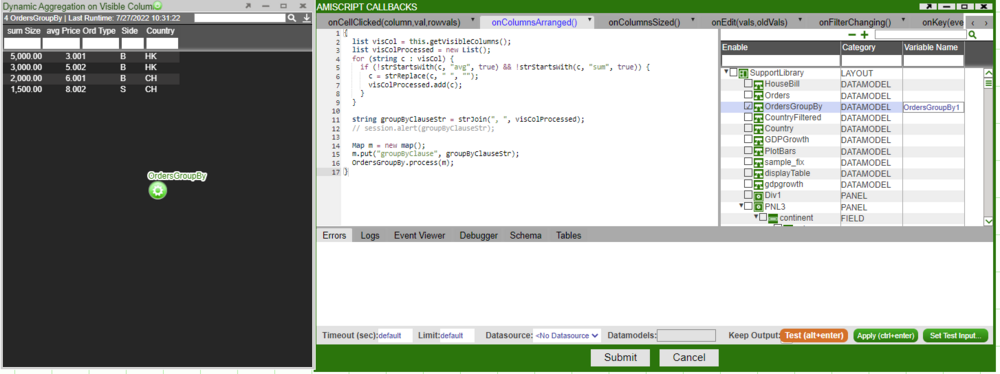
Now, go to the AmiScript Callbacks for the OrdersGroupBy table just created. Within the onColumnsArranged() paste the following code. This code first gets a list of all of the visible columns. Then we remove our aggregate columns, in this case we want to remove the sum(Size) and average(Price) columns, these are removed as they are not used in the aggregation but instead just show the results of the aggregation. We add each visible column name to a map m. We process our blender OrdersGroupBy and provide our map as the parameter, this map will be parsed as the wheres map that we use in the blender.
{
  list visCol = this.getVisibleColumns();
  list visColProcessed = new List();
  for (string c : visCol) {
    if (!strStartsWith(c, "avg", true) && !strStartsWith(c, "sum", true)) {
      c = strReplace(c, " ", "");
      visColProcessed.add(c);
    }
  }

  string groupByClauseStr = strJoin(", ", visColProcessed);
  // session.alert(groupByClauseStr);

  Map m = new map();
  m.put("groupByClause", groupByClauseStr);
  OrdersGroupBy.process(m);
}
Before we perform any aggregates, we need to edit the OrdersGroupBy blender so that when the groupByClause is null or empty we only see the sum(Size) and avg(Price) columns. Our blender should now have the following code snippet:
{
  CREATE TABLE Orders AS SELECT * FROM Orders WHERE ${WHERE};

  String groupByClause = wheres.get("groupByClause");

   if (groupByClause == null || groupByClause == "") {
    // groupByClause = "Country, OrdType, Side";
    // create table OrdersGroupBy as select ${groupByClause}, sum(Size), avg(Price) from Orders group by ${groupByClause};
    create table OrdersGroupBy as select sum(Size), avg(Price) from Orders;
  }
  else {
    create table OrdersGroupBy as select ${groupByClause}, sum(Size), avg(Price) from Orders group by ${groupByClause};
  }
}
We are now ready to hide/show columns and watch the aggregation happen. You can use the Hide This Column... option or Arrange Columns... option to hide/show columns.
Autofill Text Fields Using a Lookup
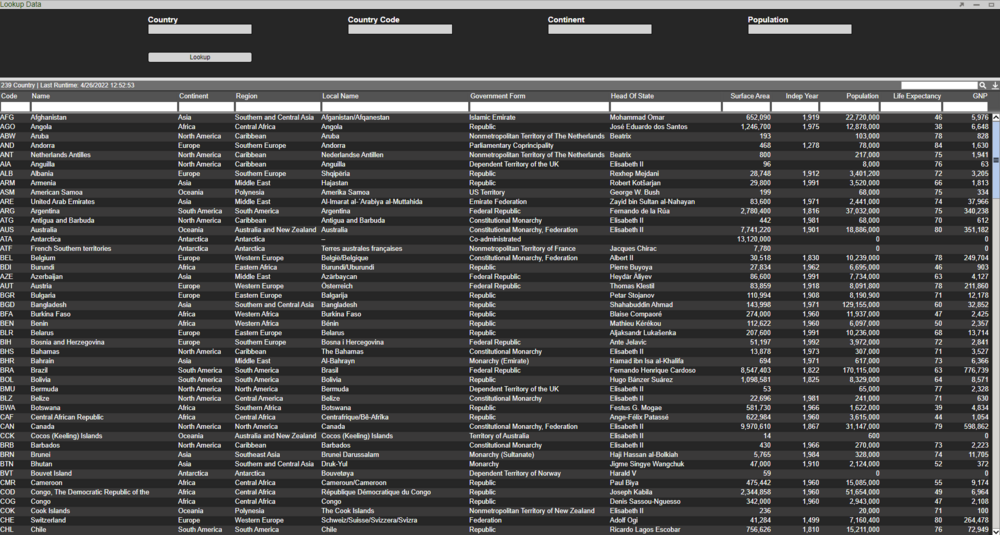
In this example we will show how to use the Country field to populate the Country Code, Continent and Population field. We will use the Country table for this example.
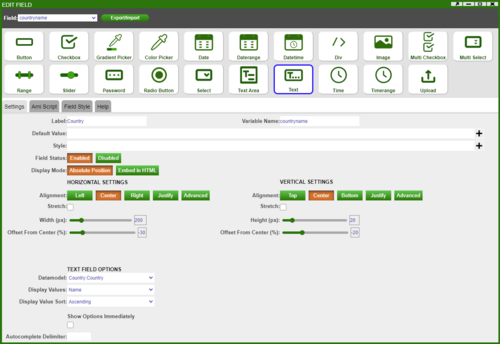
First create a HTML Panel and add a 'Text' field attached to the Country Datamodel and choose Name (here the Name column contains Country names) as the display value:
Use the same method to add the other fields of interest (ie. Country Code, Continent, Population). Next we will add a button called 'Lookup' with the following script - when this button is clicked the remaining fields will populate based on the chosen Country.
Table dbTable = layout.getDatamodel("Country").getData().get("Country");
string countryName = countryname.getValue();
Table dbTableInfo = dbTable.query("select Continent, Code, Population from this where Name==\"${countryName}\" limit 1");
string Continent = dbTableInfo.getRow(0).get("Continent");
string Code = dbTableInfo.getRow(0).get("Code");
string Population = dbTableInfo.getRow(0).get("Population");

if (strIs(Continent)) {
  continentname.setValue(Continent);
}
else {
  continentname.setValue("");
}

if (strIs(Code)) {
  countrycode.setValue(Code);
}
else {
  countrycode.setValue("");
}

if (strIs(Population)) {
  population.setValue(Population);
}
else {
  population.setValue("");
}
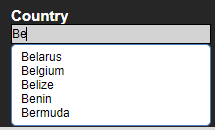
This scripts uses a function called query to get the values corresponding to the chosen Country. When searching for a Country we also get a dropdown list of the Countries:
Performing a lookup on Belgium, we can see the other fields are populated:
Filtering in Select Fields
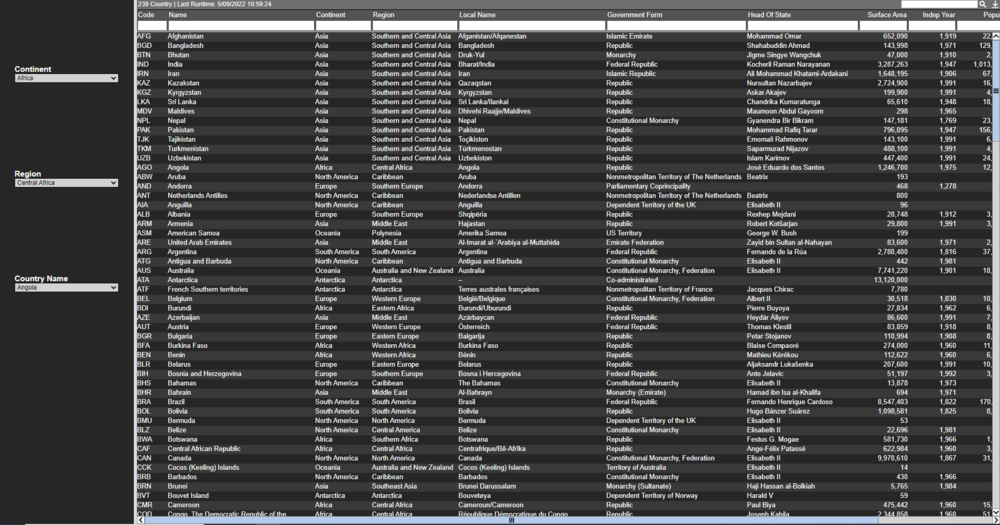
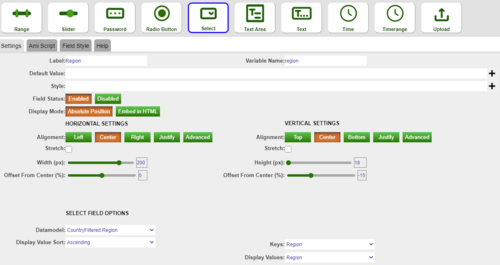
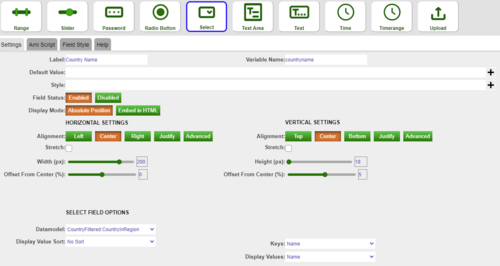
In this example we will use the Country table and create 3 select fields. The output of the first select field will be used in the WHERE clause to give the filtered selection of data which acts as the input of the second select field.
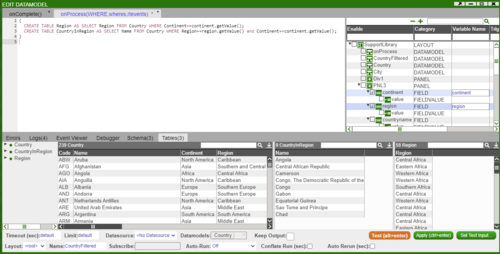
First we will create 3 select fields and call them Continent, Region and Country Name. Then create a blender on the Country datamodel called CountryFiltered and insert the following snippet:
{
  CREATE TABLE Region AS SELECT Region FROM Country WHERE Continent==continent.getValue();
  CREATE TABLE CountryInRegion AS SELECT Name FROM Country WHERE Region==region.getValue() and Continent==continent.getValue();
}
Here the continent.getValue() and region.getValue() gets the value in the select field named Continent and Region respectively.
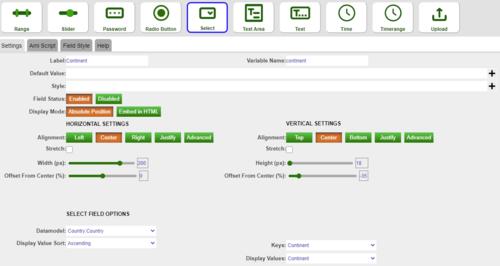
Next we will set up the three fields as shown below. We get the relevant data from the CountryFiltered datamodel.
Finally, in order for the select field options to update each time we select a different Continent or Region, we will need to reprocess the datamodel. Thus for the Continent and Region select field, add the following AMI Script:
layout.getDatamodel("CountryFiltered").reprocess();
Transpose Tables
In this example we will show how to transpose the data in a table from rows to columns in the front end and the backend.
Frontend Datamodel
First let's create a dummy table from the frontend datamodel:
{
  USE ds="AMI" EXECUTE CREATE PUBLIC TABLE HouseBills (House string, BillType string, Amount float);
  USE ds="AMI" INSERT INTO HouseBills VALUES ("House 1", "Gas", 5.2), ("House 1", "Electricity", 15.9), ("House 1", "Water", 10.3),
                                             ("House 2", "Gas", 4.5), ("House 2", "Electricity", 12.4), ("House 2", "CouncilTax", 20), ("House 2", "Water", 11),
                                             ("House 3", "Gas", 8.7), ("House 3", "Electricity", 22.5), ("House 3", "CouncilTax", 30),
                                             ("House 4", "Gas", 6.9), ("House 4", "Electricity", 20.1), ("House 4", "CouncilTax", 25.5), ("House 4", "Water", 11.8);
}
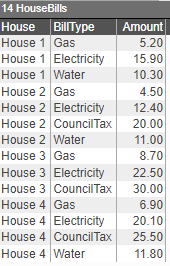
This gives us the following table:
Now we want to transpose this table so that the column headers are the different bill types and the rows contain the amount for each house. Thus since there are 4 houses, we will get a dataset with 4 rows. By using the following script we can generate our desired output:
{
  CREATE TABLE HouseBills AS USE  EXECUTE SELECT House, BillType, Amount FROM HouseBills WHERE ${WHERE};
  list HouseName = select House from HouseBills group by House;
  list billType = select BillType from HouseBills group by BillType;

  string columnHeaders = "House, " + strJoin(", ", billType);
  string columnNameSchema = "House string, " + strJoin(" float, ", billType) + " float";

  create table TransposeTable (${columnNameSchema});

  for (int i = 0; i < HouseName.size(); i++) {
    string insertVals = "";
    string house = HouseName.get(i);
    insertVals += "\"${house}\"";

    for (int j = 0; j < billType.size(); j++) {
      string bill = billType.get(j);
      float amt = select Amount from HouseBills where House == "${HouseName.get(i)}" and BillType == "${billType.get(j)}";
      insertVals += ", " + (amt != null ? amt : "null");
    }

    insert into TransposeTable (${columnHeaders}) values (${insertVals});
  }
}
We first create a datamodel on the HouseBills table that is stored in AMI. Next we extract the distinct houses names and bill types, and store it in a list named HouseName and billType respectively.
We will need to create a schema for the new transposed table - to do this we use unique list containing the bill type and perform a strJoin by adding the data type of those columns (in this case we assign their column type as a float). So the columnNameSchema string is:
House string, Gas float, Electricity float, Water float, CouncilTax float
This can now be used to create the TransposeTable.
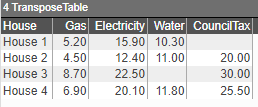
Finally we want to get the amount corresponding to each house and bill type so we perform a for-loop that extracts the required amount and appends it to the string insertVals. Note if the amount for a particular bill type doesn't exist then we will assign a null value. Once we have the string of values to insert in the correct format we can insert it into the transpose table. We get the final result as such:
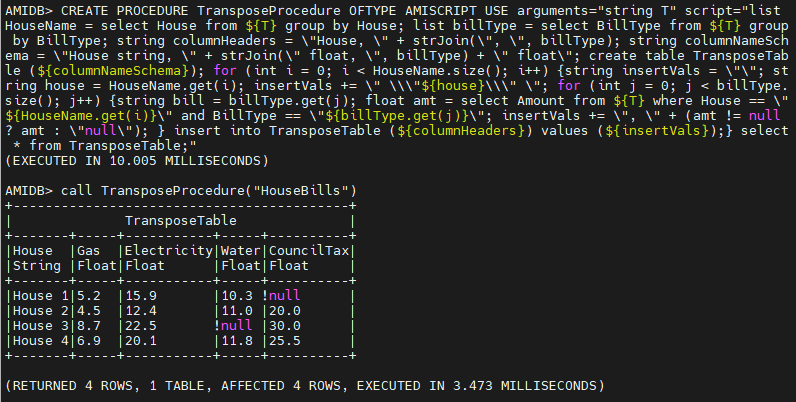
Backend Using Procedures
We can use the same script as above with a few minor changes to transpose data in the backend. The main difference will come from escaping characters:
CREATE PROCEDURE TransposeProcedure OFTYPE AMISCRIPT USE

  arguments="string T"

  script="list HouseName = select House from ${T} group by House;
          list billType = select BillType from ${T} group by BillType;

          string columnHeaders = \"House, \" + strJoin(\", \", billType);
          string columnNameSchema = \"House string, \" + strJoin(\" float, \", billType) + \" float\";

          create table TransposeTable (${columnNameSchema});

          for (int i = 0; i < HouseName.size(); i++) {
              string insertVals = \"\";
              string house = HouseName.get(i);
              insertVals += \" \\\"${house}\\\" \";

              for (int j = 0; j < billType.size(); j++) {
                  string bill = billType.get(j);
                  float amt = select Amount from ${T} where House == \"${HouseName.get(i)}\" and BillType == \"${billType.get(j)}\";
                  insertVals += \", \" + (amt != null ? amt : \"null\");
              }
              insert into TransposeTable (${columnHeaders}) values (${insertVals});
          }
          select * from TransposeTable;"
NB: for readability purposes the above has new lines and tabs - when writing the procedure ensure that it flows and there are no line breaks:
CREATE PROCEDURE TransposeProcedure OFTYPE AMISCRIPT USE arguments="string T" script="list HouseName = select House from ${T} group by House; list billType = select BillType from ${T} group by BillType; string columnHeaders = \"House, \" + strJoin(\", \", billType); string columnNameSchema = \"House string, \" + strJoin(\" float, \", billType) + \" float\"; create table TransposeTable (${columnNameSchema}); for (int i = 0; i < HouseName.size(); i++) {string insertVals = \"\"; string house = HouseName.get(i); insertVals += \" \\\"${house}\\\" \"; for (int j = 0; j < billType.size(); j++) {string bill = billType.get(j); float amt = select Amount from ${T} where House == \"${HouseName.get(i)}\" and BillType == \"${billType.get(j)}\"; insertVals += \", \" + (amt != null ? amt : \"null\"); } insert into TransposeTable (${columnHeaders}) values (${insertVals});} select * from TransposeTable;"
Snapping/Unsnapping Dividers
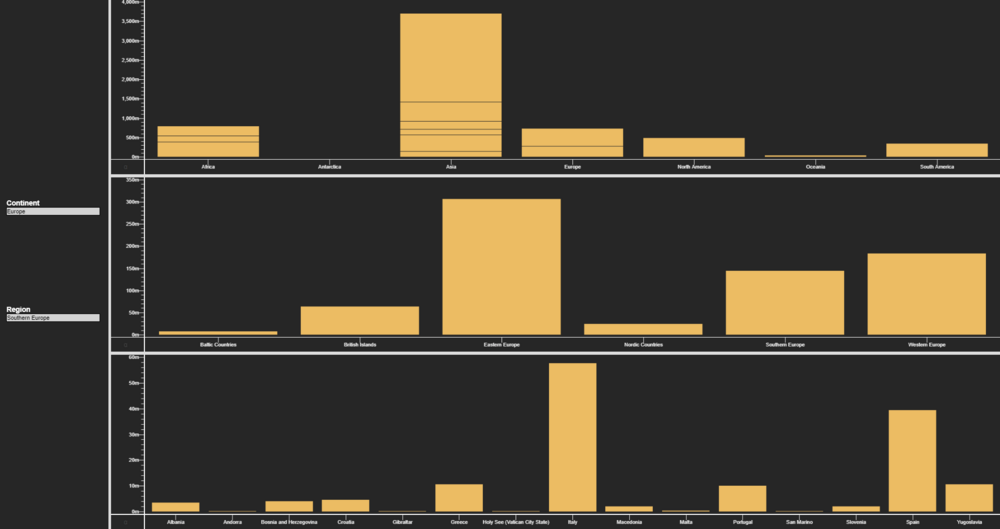
In this example we discuss how to get different charts popping up depending on the data filtering. We will again use the Country table to showcase the example.
First lets create a window with 4 panels as such:
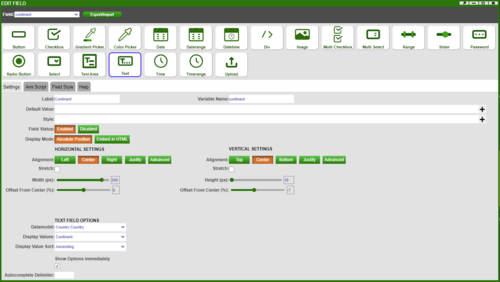
The left panel contains two Text field - one for Continent and other for Region. The Continent text field will display the values in the Continent column in the Country table from the Country datamodel:
Next, let's create a blender on the Country Datamodel called CountryFiltered which will contain the following script:
{
  CREATE TABLE RegionInContinent AS SELECT Region, sum(Population) as TotalPopulation FROM Country WHERE Continent==continent.getValue() group by Region;
  CREATE TABLE CountryInContinentRegion AS SELECT Name, Population FROM Country WHERE Continent==continent.getValue() and Region==region.getValue();
}
where continent.getValue() and region.getValue() get the values from the Continent and Region text fields respectively.
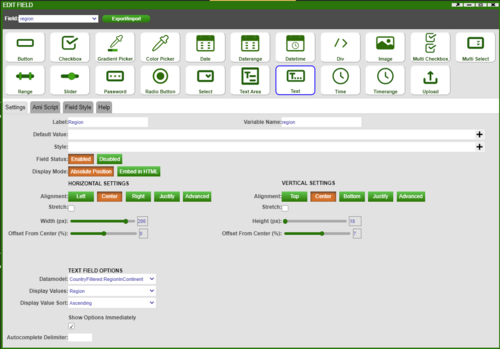
Then the Region text field will display the values in the Region column in the RegionInContinent table in the CountryFiltered datamodel:
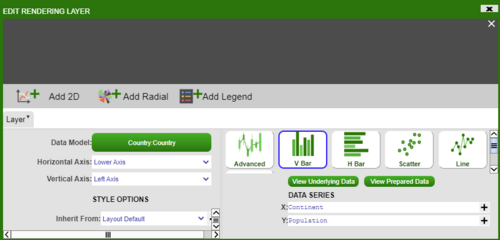
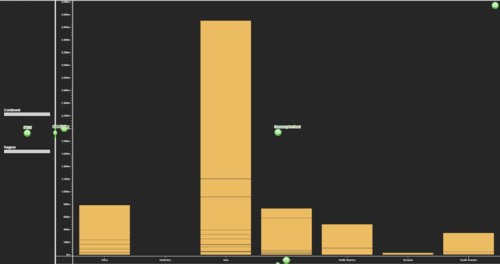
Now that the left panel is done, we will split the right panel into three and create three V Bar charts. The top most bar chart will plot Continent vs. Population from the Country table:
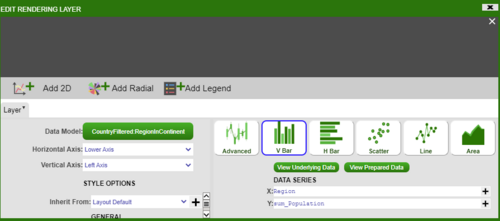
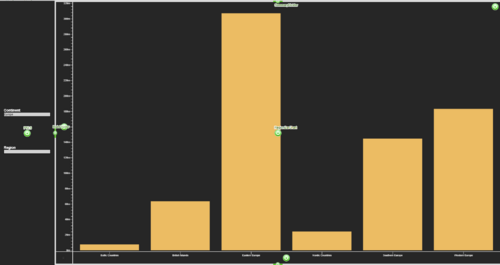
The middle bar chart will plot Region vs. TotalPopulation from the RegionInContinent table:
Similarly, the bottom bar chart will plot Name vs. Population from the CountryInContinentRegion table.
Now that we have the panels completed, we will show how to maximise the different bar charts depending on the filtering of the text fields. We want the logic as follows:
- if the Continent text field is empty we should have the Continent vs. Population plot
- if the Continent text field has a value (and Region text field is empty) we should have the Region vs. TotalPopulation plot where the Regions are in the chosen Continent
- if the Region text field has a value we should have the Country Name vs. Population plot
To get this we need to add the following script to the Continent text field:
if (continent.getValue() == "") {
  SummaryDivider.unsnap();
  SummaryDivider.setSnapDirection("Bottom");
  SummaryDivider.snap();
}
else {
  SummaryDivider.unsnap();
  SummaryDivider.setSnapDirection("Top");
  SummaryDivider.snap();
  RegionDivider.setSnapDirection("Bottom");
  RegionDivider.snap();
}

layout.getDatamodel("CountryFiltered").reprocess();
and the following script to the Region text field:
if (region.getValue() == "") {
  RegionDivider.unsnap();
  RegionDivider.setSnapDirection("Bottom");
  RegionDivider.snap();
}
else {
  RegionDivider.unsnap();
  RegionDivider.setSnapDirection("Top");
  RegionDivider.snap();
}

layout.getDatamodel("CountryFiltered").reprocess();
where the SummaryDivider is the divider between Continent vs. Population plot and Region vs. TotalPopulation plot, and RegionDivider is the divider between Region vs. TotalPopulation plot and Name vs. Population plot.
Transferring Historical Data from one Center to a Historical Center
In this example we will write a simple procedure to transfer historical data from one center to another.
In our working center we will use a table with the following schema;
CREATE PUBLIC TABLE DataTable (AccountID String, Price double, Quantity Double, Date Long, D long);
Similarly, in the center with historical data we have a table with the same name but a different schema:
CREATE PUBLIC TABLE DataTable (AccountID String, Price double, Quantity Double, Date Long, SourceD Long, HistDate Long);
NB: D is an auto-generated incrementing unique id for the row which unique across all tables (see Reserved Columns on Public Tables - https://docs.3forge.com/mediawiki/AMI_Realtime_Database#Reserved_columns_on_public_Tables).
Next we will use the below procedure to transfer the historical data. The arguments for the procedure are as follows:
- tableName - this is the table you will be transferring data from and to (ie. DataTable)
- histCenter - this is the name of the datasource where the historical data will sent to
- whereClause - argument that can be used to get the data you want to transfer (ie. you may want to send across data where Date == 20220101)
- batchSize - argument to specify the number of data rows to send across in each go
Note that this procedure uses column D to decide which data to send.
 CREATE PROCEDURE MoveRowsToHist OFTYPE AMISCRIPT USE

   arguments="string tableName, string histCenter, string whereClause, int batchSize"

   script="long histDate = formatDate(timestamp(), \"yyyyMMdd\", \"UTC\");
           long srcTblDmax = select max(D) from ${tableName} where ${whereClause};
           srcTblDmax = srcTblDmax != null ? srcTblDmax : 0L;
           int destTblDmax = use ds=${histCenter} execute select max(SourceD) from ${tableName} where ${whereClause} AND HistDate == ${histDate};
           destTblDmax = destTblDmax != null ? destTblDmax : 0;

           while (srcTblDmax > destTblDmax) {
               use ds=${histCenter} insert into ${tableName} from select * except(D), D as SourceD, ${histDate} as HistDate from ${tableName}
                   where ${whereClause} AND D > destTblDmax limit batchSize order by SourceD;
               destTblDmax = use ds=${histCenter} execute select max(SourceD) from ${tableName} where ${whereClause} AND HistDate == ${histDate};
          }"
CREATE PROCEDURE MoveRowsToHist OFTYPE AMISCRIPT USE arguments="string tableName, string histCenter, string whereClause, int batchSize" script="long histDate = formatDate(timestamp(), \"yyyyMMdd\", \"UTC\"); long srcTblDmax = select max(D) from ${tableName} where ${whereClause}; srcTblDmax = srcTblDmax != null ? srcTblDmax : 0L; int destTblDmax = use ds=${histCenter} execute select max(SourceD) from ${tableName} where ${whereClause} AND HistDate == ${histDate}; destTblDmax = destTblDmax != null ? destTblDmax : 0; while (srcTblDmax > destTblDmax) {use ds=${histCenter} insert into ${tableName} from select * except(D), D as SourceD, ${histDate} as HistDate from ${tableName} where ${whereClause} AND D > destTblDmax limit batchSize order by SourceD; destTblDmax = use ds=${histCenter} execute select max(SourceD) from ${tableName} where ${whereClause} AND HistDate == ${histDate};}"
Create Table to Display Values from Particular Row
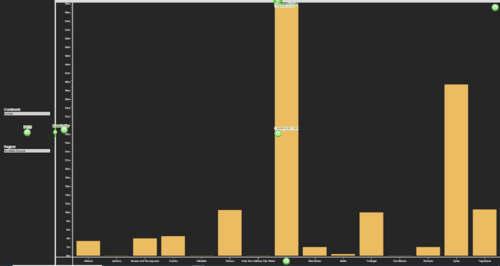
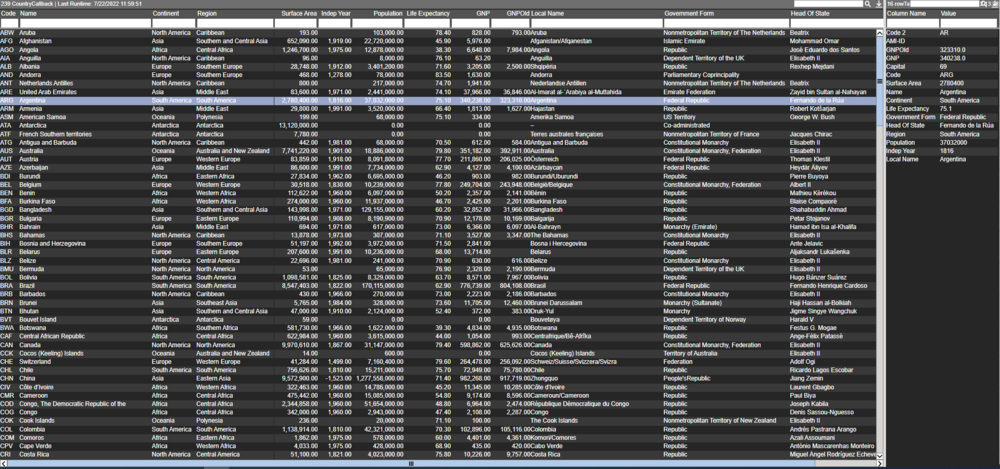
In this example we will show how to display the row values from a table in another table. This will be the end result:
Firstly, we will create a table visualisation on the Country table (or table or your choice).
Next create a datamodel with the display table:
{
  create table RowTable (ColumnName String, Value String);
}
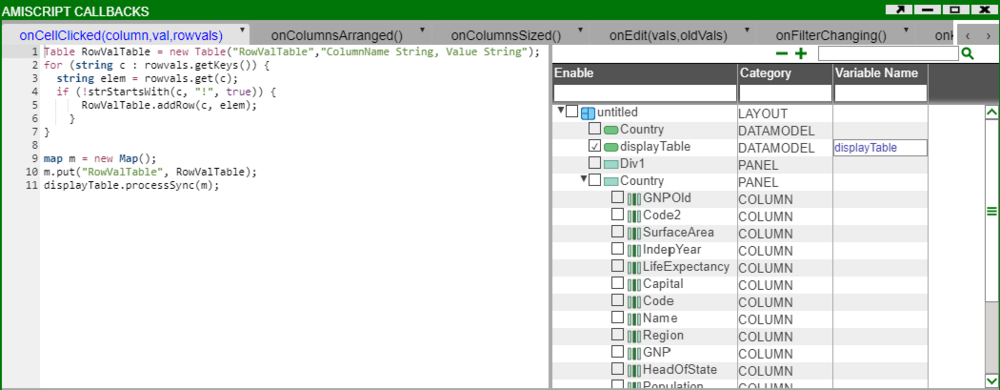
Next we want to create a callback such that every time we click on a values in a row it will generate the display table (table in the right panel above). To do this we will use the onCellClicked(column,val,rowval) callback under amiscript callbacks for the table panel. The following script will get the row values and the corresponding column names and save it in the table.
Table RowValTable = new Table("RowValTable","ColumnName String, Value String");
for (string c : rowvals.getKeys()) {
  string elem = rowvals.get(c);
  if (!strStartsWith(c, "!", true)) {
      RowValTable.addRow(c, elem);
    }
}

map m = new Map();
m.put("RowValTable", RowValTable);
displayTable.processSync(m);
Enable the displayTable datamodel from the Variable Tree on the right so that the script knows what datamodel to process:
Now we need to make the columns clickable so choose one column (or any number) and under edit column turn on clickable.
Test this and then create a visualisation on the display table in the right panel. Now to have the datamodel containing the display table to update with the row values from the main table, we will update the displayTable code snippet to:
{
  // create table RowTable (ColumnName String, Value String);
  Table RowValTable = wheres.get("RowValTable");
  create table RowTable as select * from RowValTable;
}
NB. when you test this you may get a runtime error of unknown table; you can ignore this error.
Finally, clicking on an clickable cell in the Country table will automatically populate the display table.
Duplicate Panels Programmatically
In this example we will show how to duplicate any panel programmatically instead of importing/exporting the panel manually.
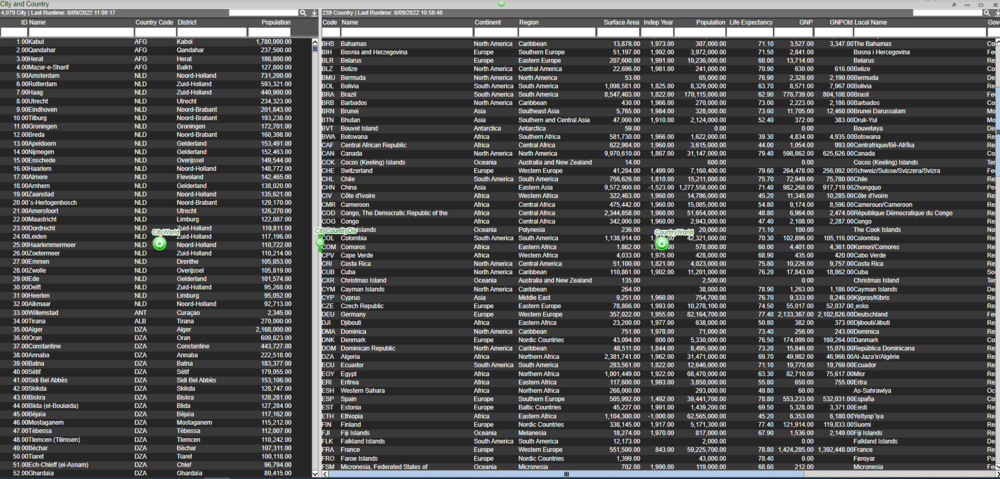
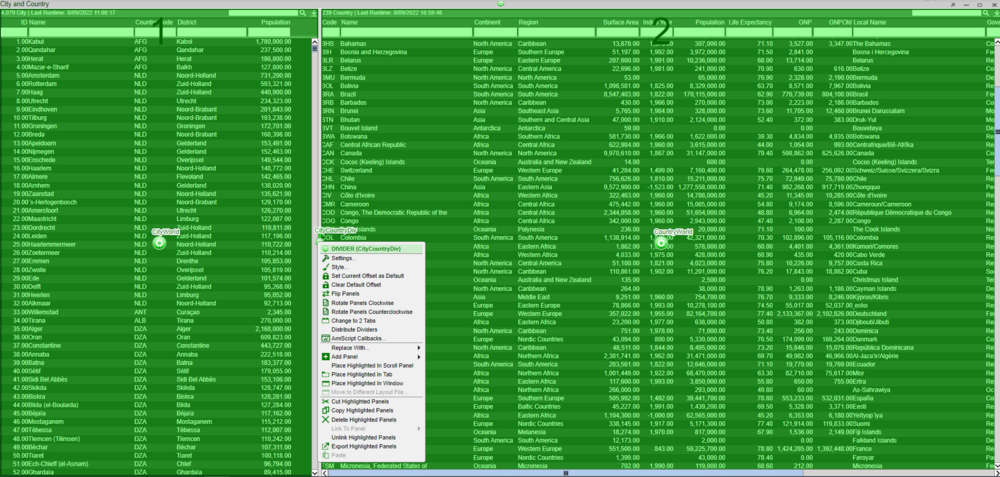
Let's first create panel that we want to duplicate; here we have a window with the City table on the left and Country table on the right. We've named the left panel with the City table as CityWorld and the right panel with the Country table as CountryWorld. There is also a divider between the two tables which we have named CityCountryDiv (to rename this go to green cog of the Divider -> Settings -> PanelID).
Note that this divider is how we would access both the left and right panel.
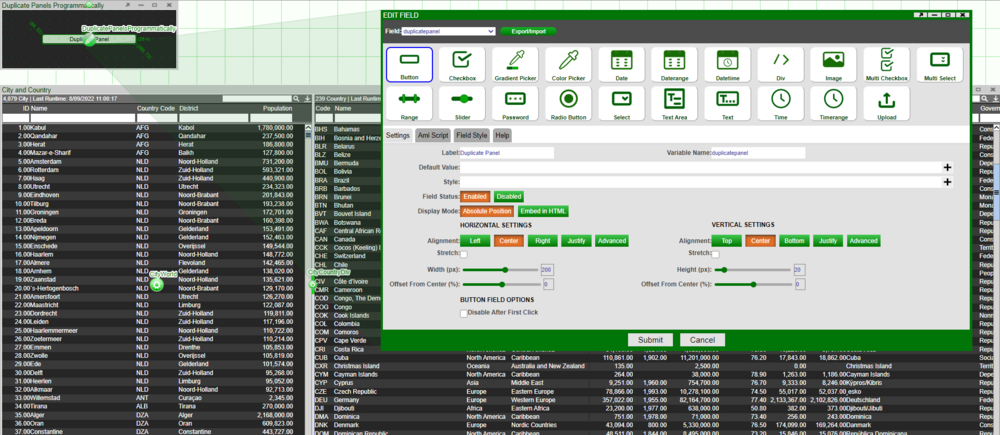
Let's create a HTML Panel with a button that duplicates this window when clicked on. We'll call this button Duplicate Panel:
Add the following snippet of code in the Ami Script tab of the button - this code exports the config of the named panel and re-imports it as a new window:
Map config = layout.getPanel("CityCountryDiv").exportConfig();
session.importWindow("New Window",config);
Exit the development mode and click on the Duplicate Panel button - this now generates a new window called New Window containing the duplicate of the panel.
NB: If you only wish to duplicate the CityWorld panel, replace getPanel("CityCountryDiv") with getPanel("CityWorld").
Flashing Cells
Apply row-wise filters based on a specific column
oftentimes, the user might want to only show specific rows and hide the other rows based on a specific column. The following example demonstrates how we can apply row-wise filter based on a specific column in a real time table, as well as how to show summary of a given table and how to align two tables in the panel programmatically.
1.Creating the demo table
For this demonstration, we need to create a real time table with the following schema and data.
create public table RT_table(System string, Symbol string, Quantity integer);

insert into RT_table values("sys1","TSLA",20),("sys2","AAPL",30),("sys3","AAPL",30),("sys1","TEST",60),
			   ("sys2","AAPL",10),("sys3","TEST",80),("sys3","TSLA",80),("sys2","TSLA",45);
Set visible columns
Suppose we only want to visualize the columns "System" and "Quantity", hiding column "Symbol". We can do this via ami script, using the ami script function setVisibleColumns() against your real time table panel. To achieve this, one solution is to create a button such that when the user clicks the button, the setVisibleColumns() function will be triggered. If we double click the button, go to the tab Ami Script, and enter the following command:
list VisibleCols = new list("Quantity","System");
aggPnl.setVisibleColumns(VisibleCols);
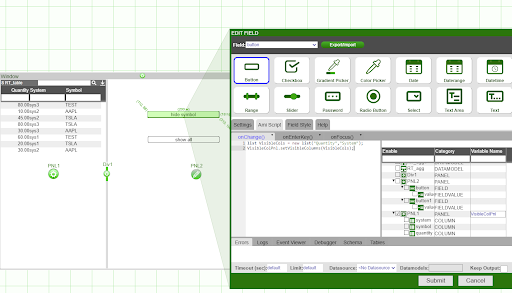
Inside the function setVisibleColumns(), we can specify the names of the columns we want to make visible and pass in this as a list. Once we click the button, now the real time table only has columns "System" and "Quantity".
2. Apply row-wise filters to rows where Symbol=="TEST"
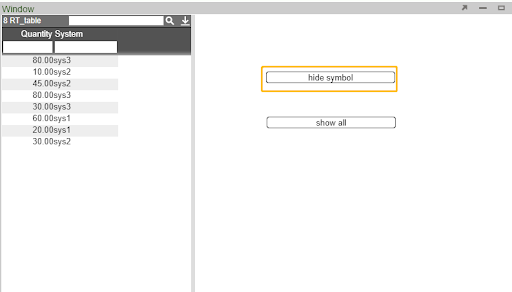
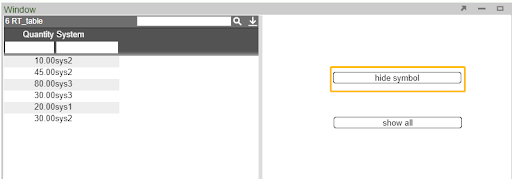
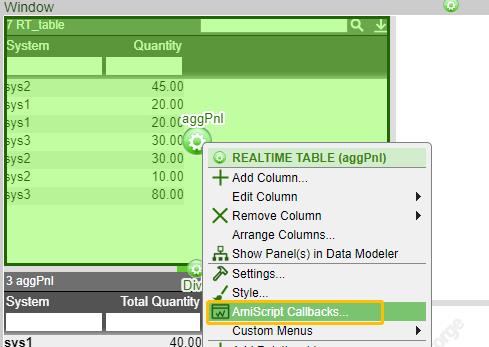
Suppose we want to aggregate on the table excluding the rows where Symbol=="TEST", here is how we can configure this using ami script to programmatically set up the filter. If we go to our panel, and right click on the central button, select AmiScript Callbacks
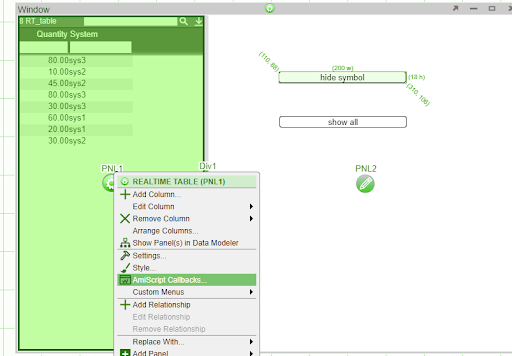
Go to the tab onColumnsArranged(), and enter the following command:
if (visiblePnl.getVisibleColumns().contains("System") && !visiblePnl.getVisibleColumns().contains("Symbol")) //if visible cols contain system but not symbol
{
  visiblePnl.setCurrentWhere("\"Symbol\"!=\"TEST\"")//anything whose symbol is not equal to TEST will be displayed, i.e. set filter to filter out rows where symbol=="TEST"
}
else
{
  visiblePnl.setCurrentWhere("true"); //display everything
}
Now if I hit the submit button, everytime there is a change in the column arrangement, the onColumnsArranged() callback gets fired. In this case, all the rows whose symbol=="TEST" will not be displayed.
3. Aggregate on the visible columns and rows
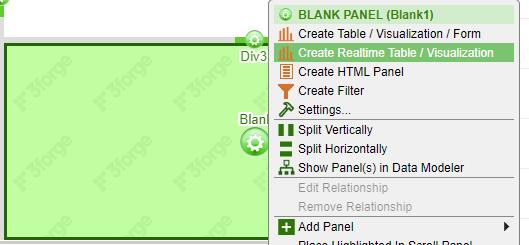
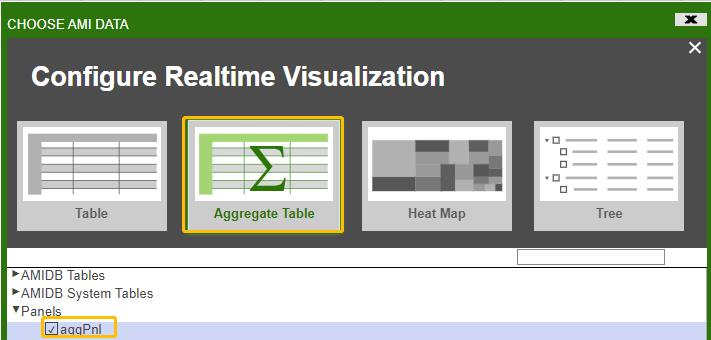
Once the filters are properly set up, we might also want to do a real-time aggregate table on this. Let's open up a new panel and right click on the central button, select create realtime table/visualization and choose Aggregate Table widget against aggPnl (which is the panel after we apply row & column-wise filters)
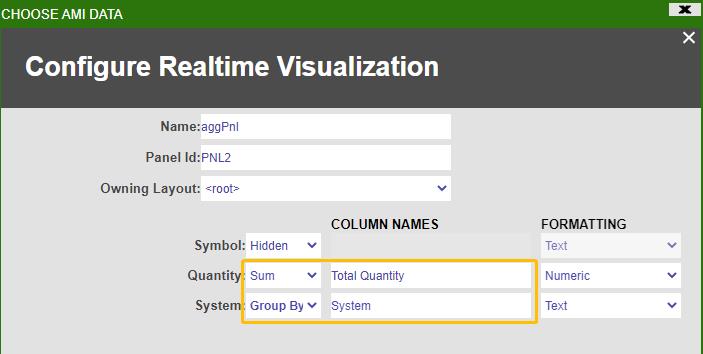
Next fill in the fields to specify on what columns you want to do aggregation on. Suppose we want to group by only on System and return the sum(Quantity), then we can configure the table like this:
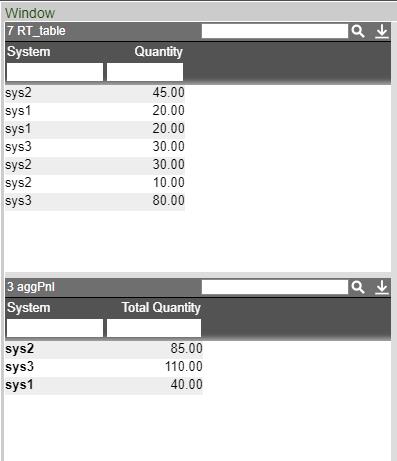
The final window that consists both panels may look something like this:
4.Show summary of table
We may also want to show a summary of the table. The way to do this is to right click the central button on the table you want to show summary of, and go to settings. Then scroll all the way down and enable summary of rows
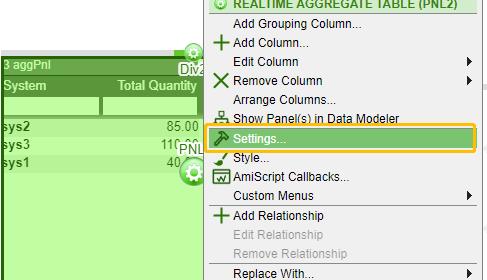
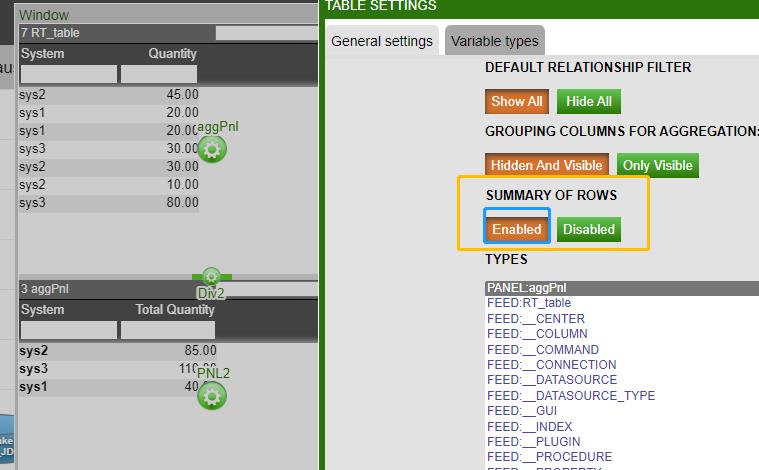
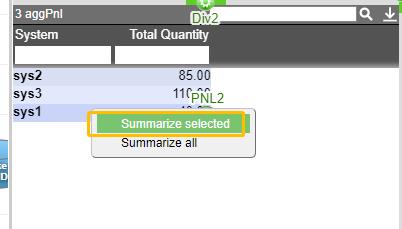
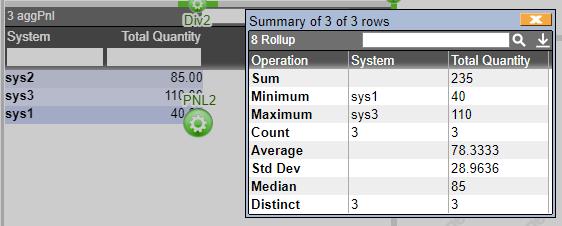
Once enabled, now we can select the rows we want to show summary of and right click -> Summarize selected
Align the tables in the panels
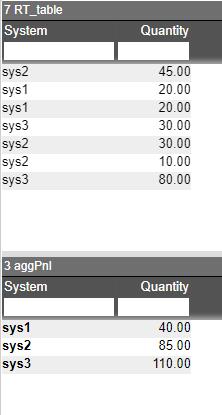
Suppose we want to align the following two tables that are situated in two separate panels.
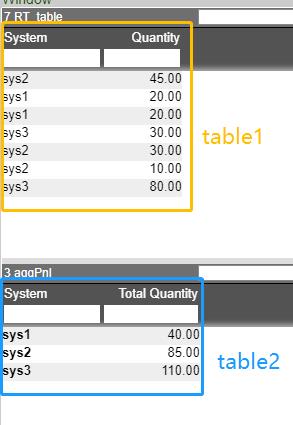
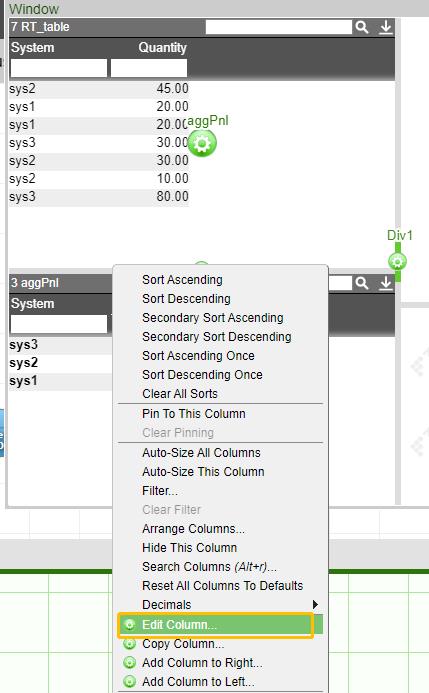
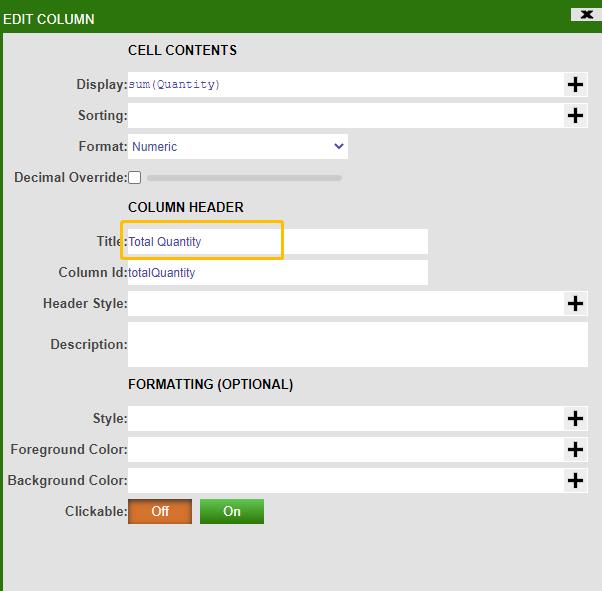
First, we need to make sure that the two tables must have identical column headers. Let's modify the second column header name Total Quantity to Quantity to match the corresponding column header name in table 1.
To do this, let's right click on the second column in table 2 and select edit column
Go to the Column Header, and modify Title field
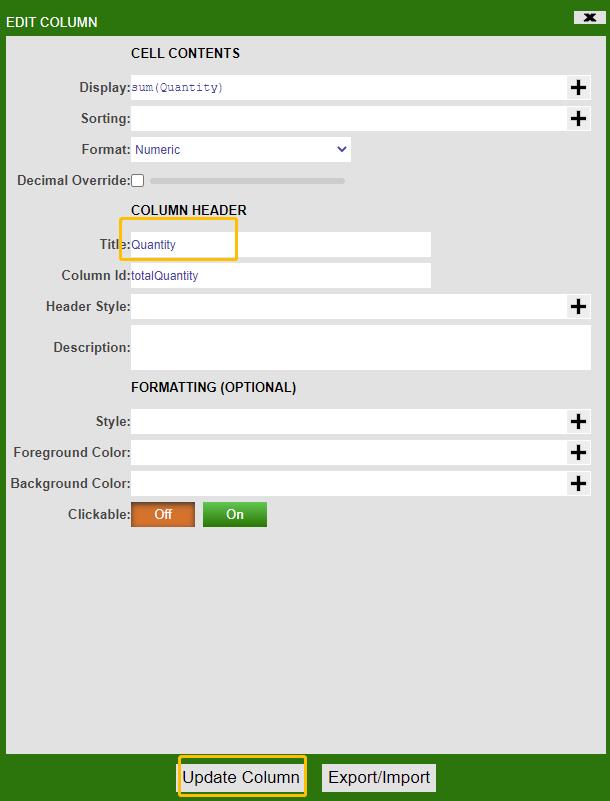
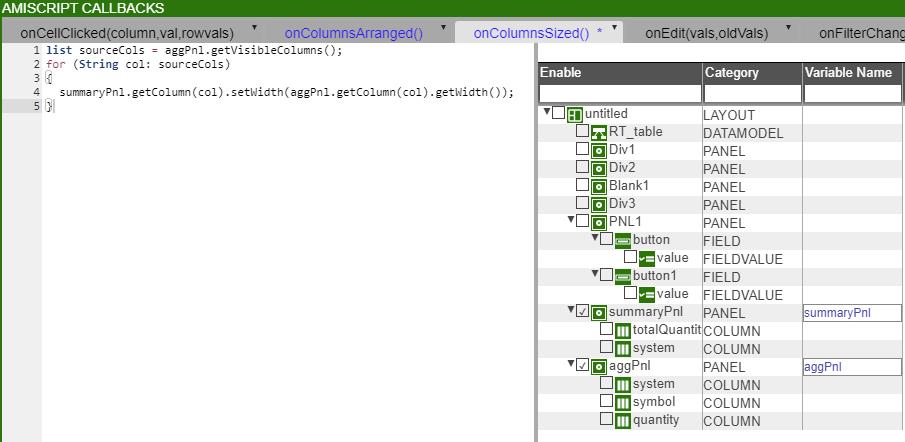
Right click on table1, go to AmiScript Callbacks and then go to OnColumnSized, enter the following amiscripts and hit submit
list sourceCols = aggPnl.getVisibleColumns();
for (String col: sourceCols)
{
  summaryPnl.getColumn(col).setWidth(aggPnl.getColumn(col).getWidth());
}
Now the two tables are fully aligned. You could drag either one of the tables however you want, you will find both tables will always stay aligned and in sync.
Include and Apply New Style To Your Dashboard
AMI has several layout styles you could choose from. These layout styles are encoded in JSON format files and are placed in amione/data/styles directory. In this example, we have a stylesheet called DARKMATTER.amistyle.json and show how to include it in AMI.
1.Navigate to the AMI installation path and place the attached JSON file inside the styles directory (amione/data/styles)

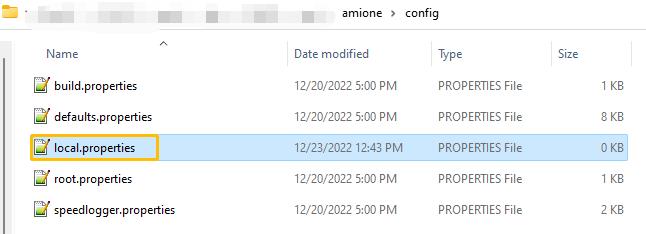
2.Navigate to /amione/config and add the following inside local.properties file
ami.style.files=data/styles/*amistyle.json
3.Restart AMI
shut down the current AMI instance and restart
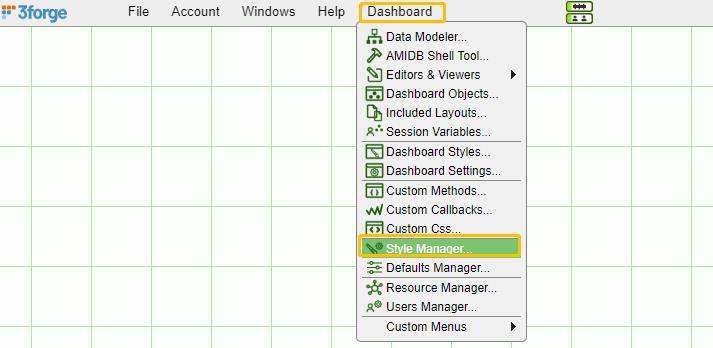
4.Log in and open Dashboard > Style Manager
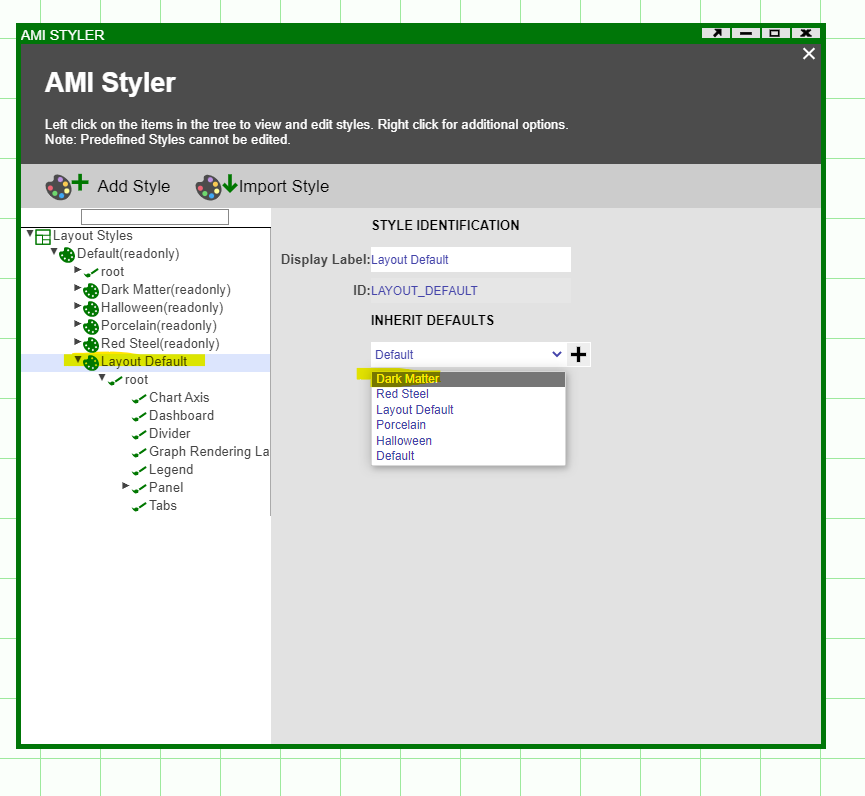
5.Select Layout Default from tree and Dark Matter from the dropdown list
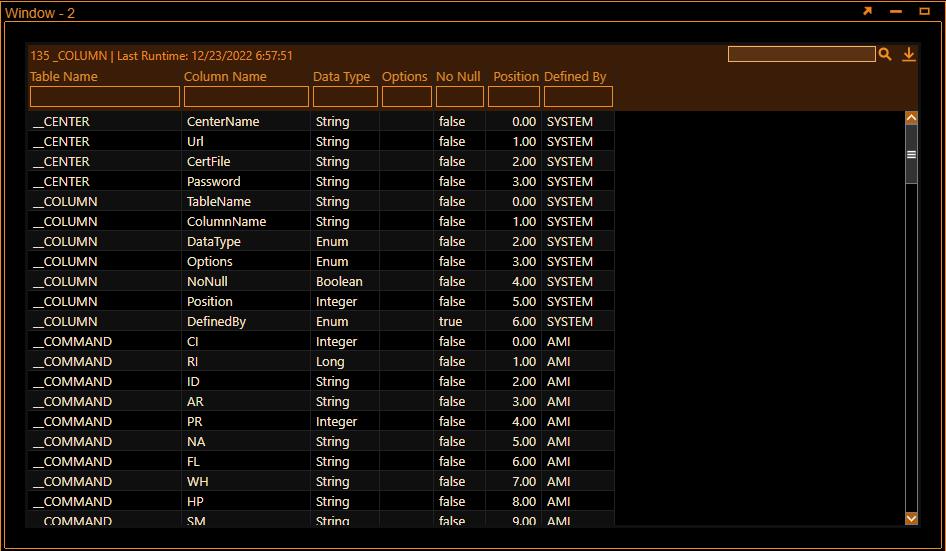
Your dashboard should now pick up the styles from the Dark Matter stylesheet.
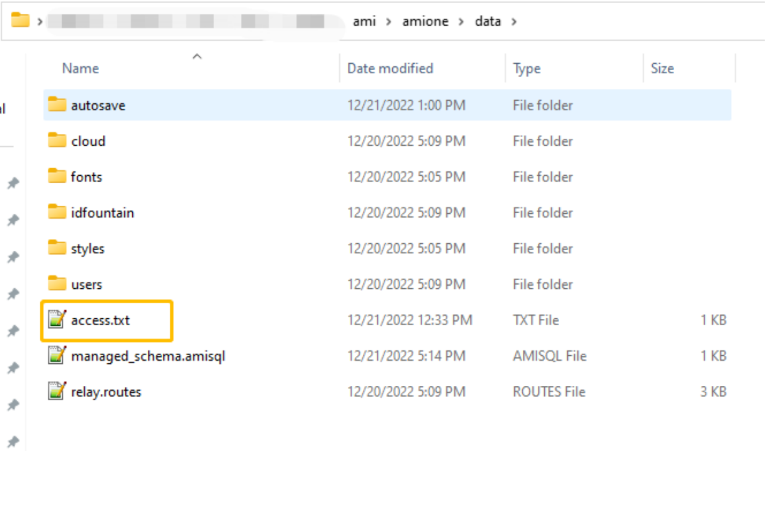
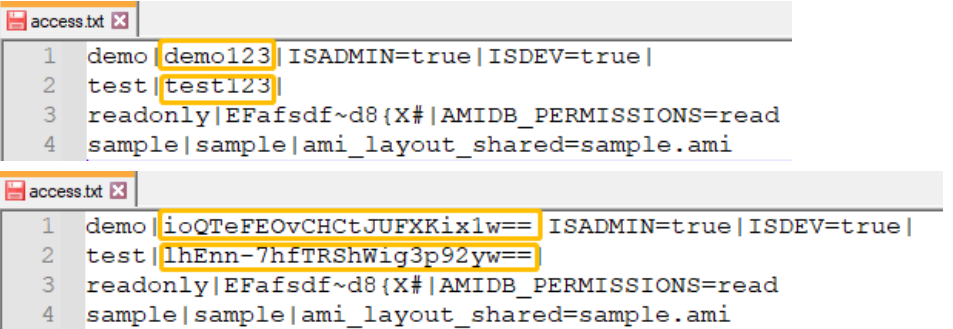
Encrypting passwords in access.txt
3forge recommends using the access.txt Authentication (AmiAuthenticatorFileBacked Authentication Plugin) only for demo purposes, for production environments we recommend implementing a AmiAuthenticator Plugin. By default, AMI does not encrypt passwords in the access.txt. This document details the steps for encrypting passwords in your access.txt.
1. Ensure your 3forge AMI Application is running. Your access.txt by default would be located in your data directory.
2. This document will contain a list of all users and their passwords as well as their permissions.
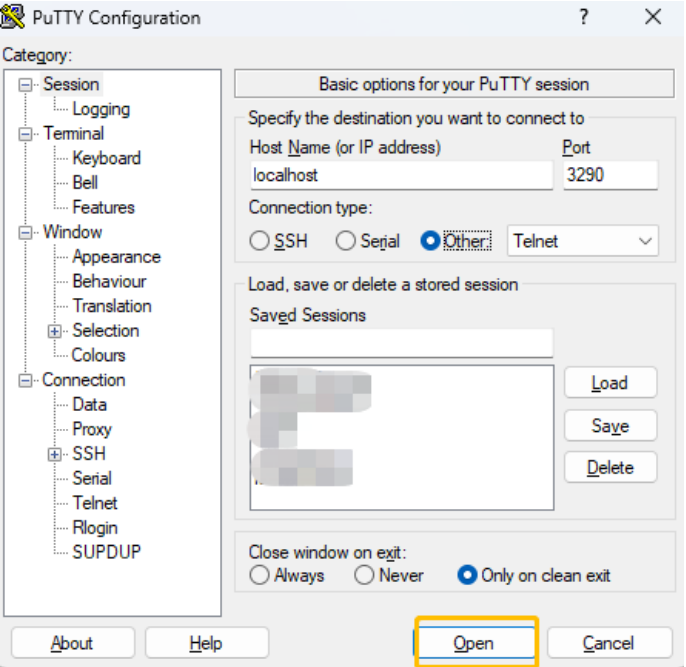
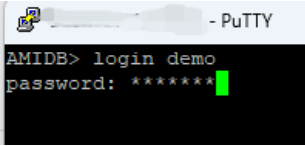
3. To start encrypting the passwords you will need to generate the encrypted string for each password. To do so you will need to telnet to your ami.db.console.port whose default value is 3290 and login to a user with DB permissions.
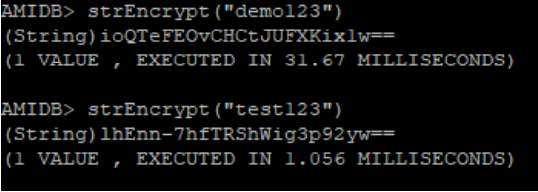
4.To encrypt each password, run the AMIScript method on the console strEncrypt("your-password"). This command will return your encrypted password.
5. For each password in the access.txt update the password with the encrypted value.
6. Add a new property in a local.properties or create one in your config directory. In the file add the following property: users.access.file.encrypt.mode=password
7. The final step is to restart your 3forge AMI Application
1st Note: Store the amikey.aes securely so that you have a recovery mechanism setup for this in case of data loss. This key by default is set by the property and configured with: ami.aes.key.file=persist/amikey.aes. If lost, users will not be able to login to their accounts.
2nd Note: To change the the access.txt file set the property: users.access.file=pathToYourAccess.txt
Window Visibility Permission Control Over Different User Groups
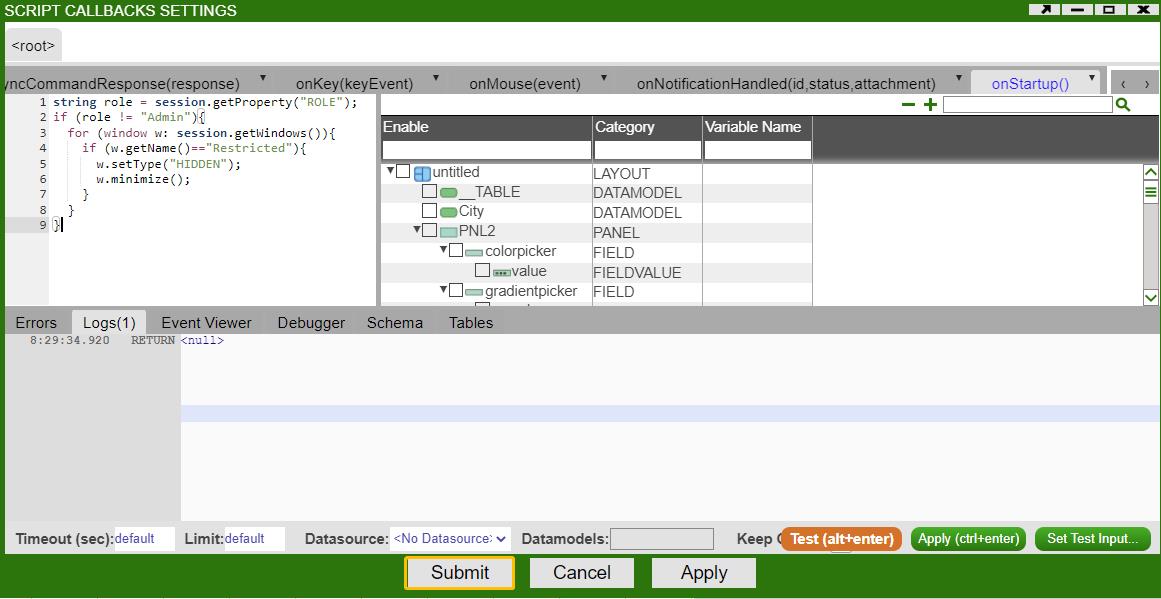
AMI has its own way of doing permission control over different groups of users so that certain windows are only visible to users with entitlements. Suppose we have two windows named Restricted and Everyone. The Restricted window should NOT be visible to the users whose role is NOT Admin. The following screenshot shows how to set up such a scenario.
1.Go to Dashboard -> Custom Callbacks
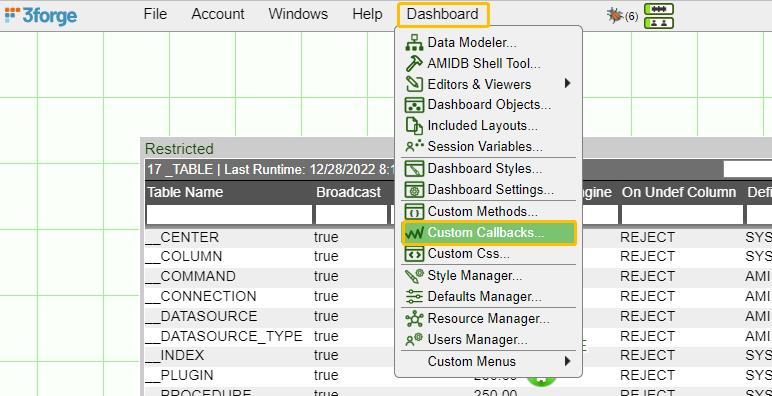
2.Go to onStartup tab and enter the following AMI script commands:

string role = session.getProperty("ROLE");
if (role != "Admin"){
  for (window w: session.getWindows()){
    if (w.getName()=="Restricted"){
      w.setType("HIDDEN");
      w.minimize();
    }
  }
}
3. Hit Submit
Now the users should be able to see different windows based on their entitlements.
Subscribe to Realtime Tables/feeds From a Datamodel and Listen for Changes to Update Form Fields
Suppose we have two real time tables: ReconFailure and ReconSuccess that keeps track of successful and failed transactions across different systems in real time, initially set to zero
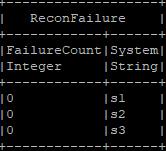
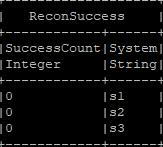
You can use the following code to follow along this tutorial
drop table if exists ReconFailure;
create public table ReconFailure(FailureCount int, System string);
insert into ReconFailure values(0,"s1"),(0,"s2"),(0,"s3");

drop table if exists ReconSuccess;
create public table ReconSuccess(SuccessCount int, System string);
insert into ReconSuccess values(0,"s1"),(0,"s2"),(0,"s3");
1. Build a datamodel against two real time tables ReconFailure and ReconSuccess
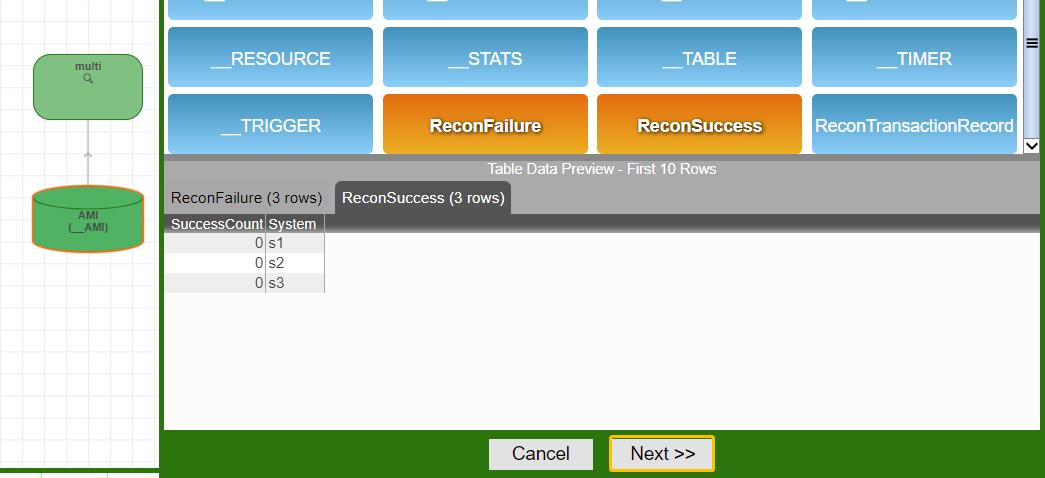
2. Configure the form fields (using text field in this case)
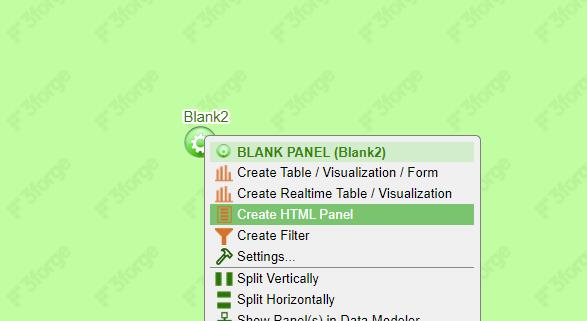
In a new panel, hit the central button, go to Create HTML Panel
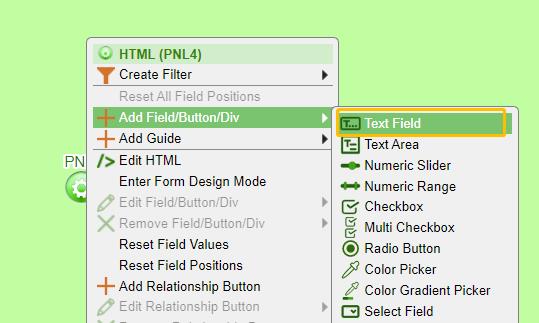
Hit the central button in the middle, go to Add Field-> Text Field
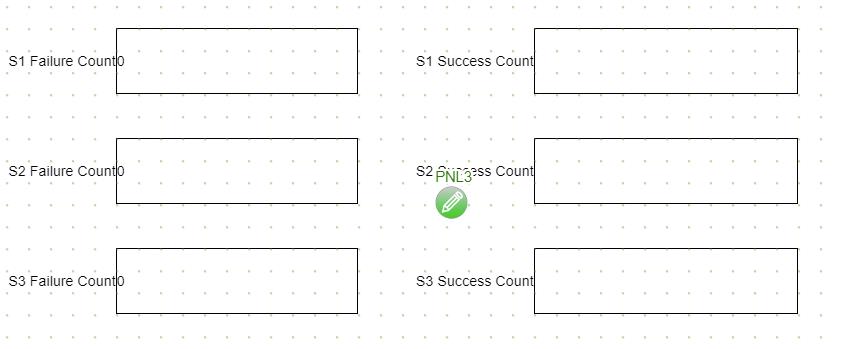
Make 6 Text fields as below:
3. Edit the datamodel and set up form field variables that match the two real time table schemas
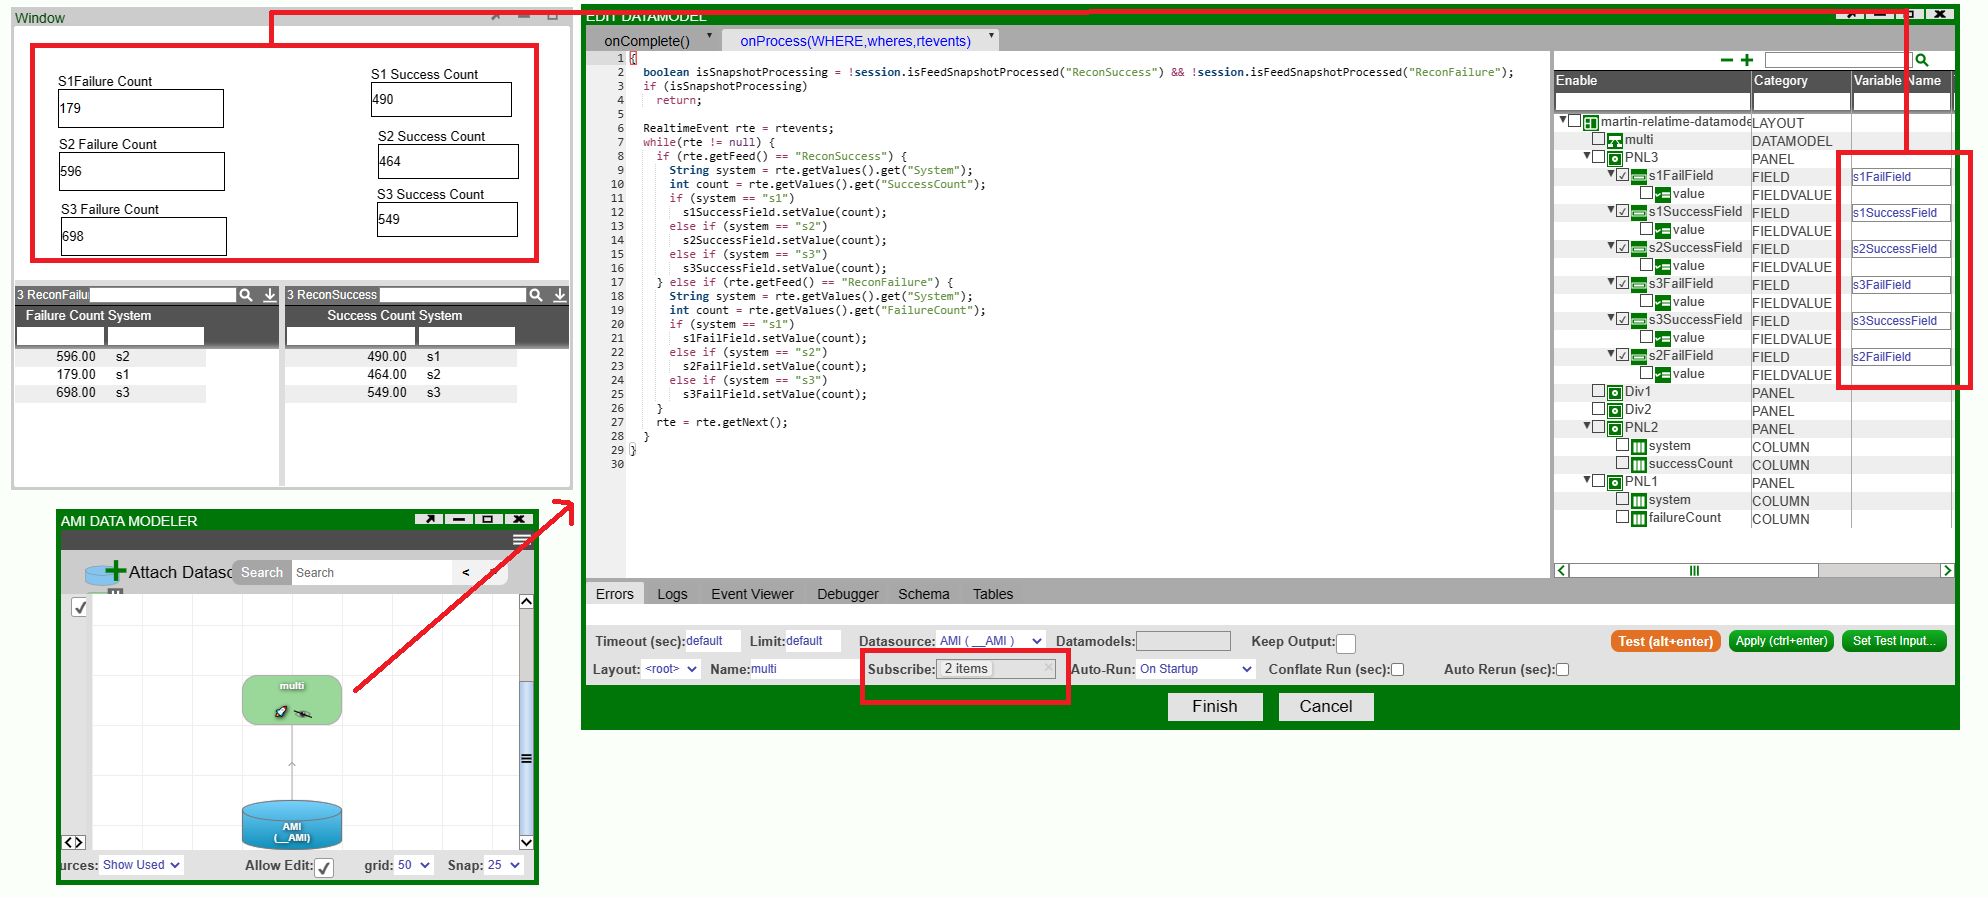
4.Subscribe to two real time feeds: ReconFailure and ReconSuccess
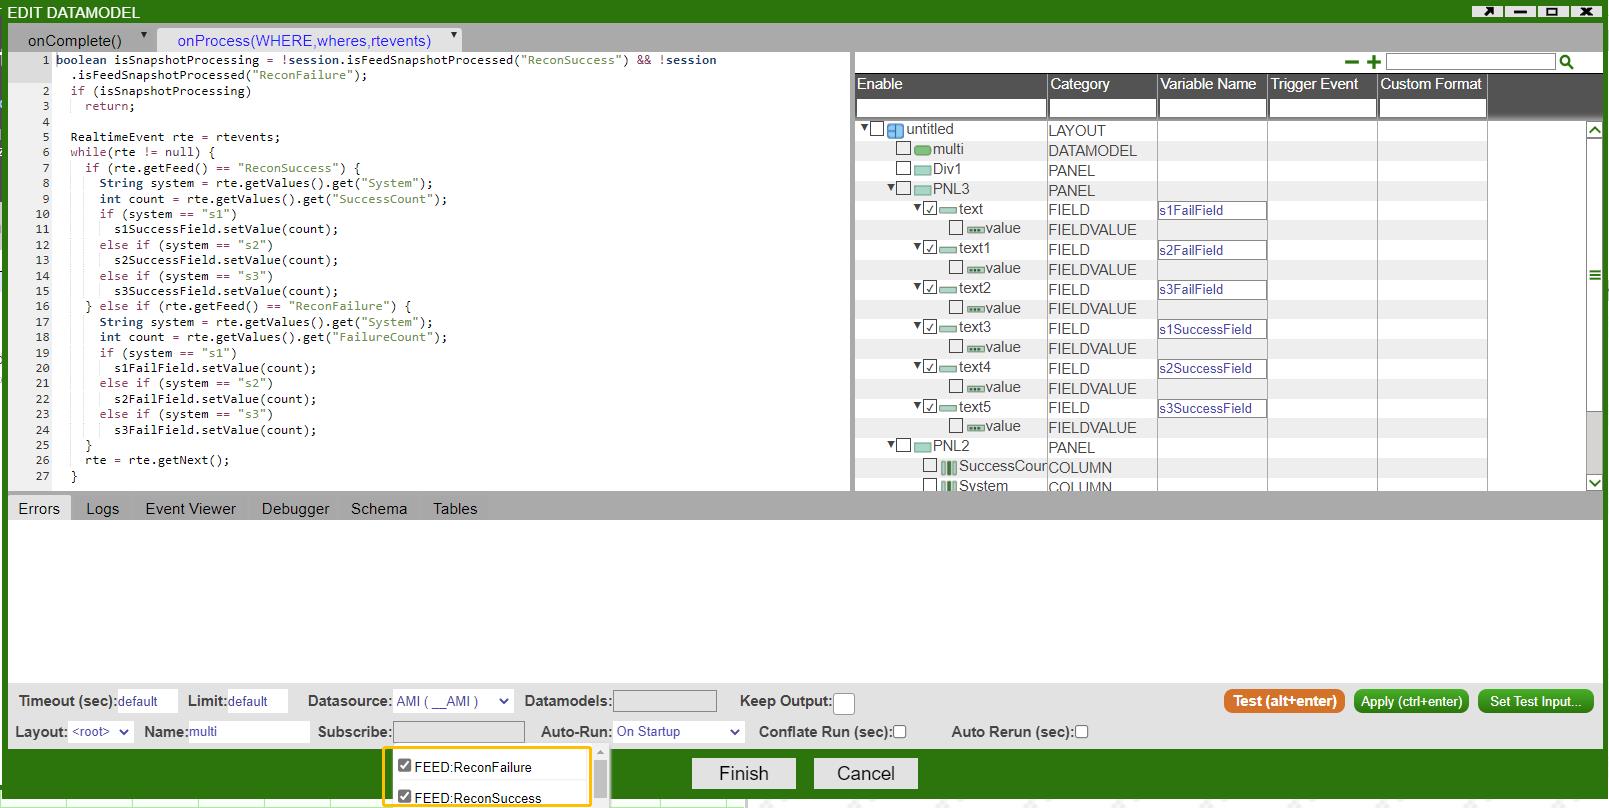
5. Go to OnProcess and enter the following code script
boolean isSnapshotProcessing = !session.isFeedSnapshotProcessed("ReconSuccess") && !session.isFeedSnapshotProcessed("ReconFailure");
  if (isSnapshotProcessing)
    return;

  RealtimeEvent rte = rtevents;
  while(rte != null) {
    if (rte.getFeed() == "ReconSuccess") {
      String system = rte.getValues().get("System");
      int count = rte.getValues().get("SuccessCount");
      if (system == "s1")
        s1SuccessField.setValue(count);
      else if (system == "s2")
        s2SuccessField.setValue(count);
      else if (system == "s3")
        s3SuccessField.setValue(count);
    } else if (rte.getFeed() == "ReconFailure") {
      String system = rte.getValues().get("System");
      int count = rte.getValues().get("FailureCount");
      if (system == "s1")
        s1FailField.setValue(count);
      else if (system == "s2")
        s2FailField.setValue(count);
      else if (system == "s3")
        s3FailField.setValue(count);
    }
    rte = rte.getNext();
  }
6. Set up timers to simulate real time feeds
For the sake of demonstration, I am using two timers here to update two real time tables ReconFailure and ReconSuccess. In real life scenarios, you may connect to some external real time feeds.
//timer1 to update ReconSuccess
create timer SuccessTransaction oftype AMISCRIPT on "500" USE script= "list Systems = new list(\"s1\",\"s2\",\"s3\"); int SysID = rand(3); String sys = Systems.get(SysID); Update ReconSuccess set SuccessCount=SuccessCount+1 where System==sys;"
//timer2 to update ReconFailure
create timer FailureTransaction oftype AMISCRIPT on "500" USE script= "list Systems = new list(\"s1\",\"s2\",\"s3\"); int SysID = rand(3); String sys = Systems.get(SysID); Update ReconFailure set FailureCount=FailureCount+1 where System==sys;"
Once enabling the timer, the figures in the text fields will be in sync with the counts in two real time tables.
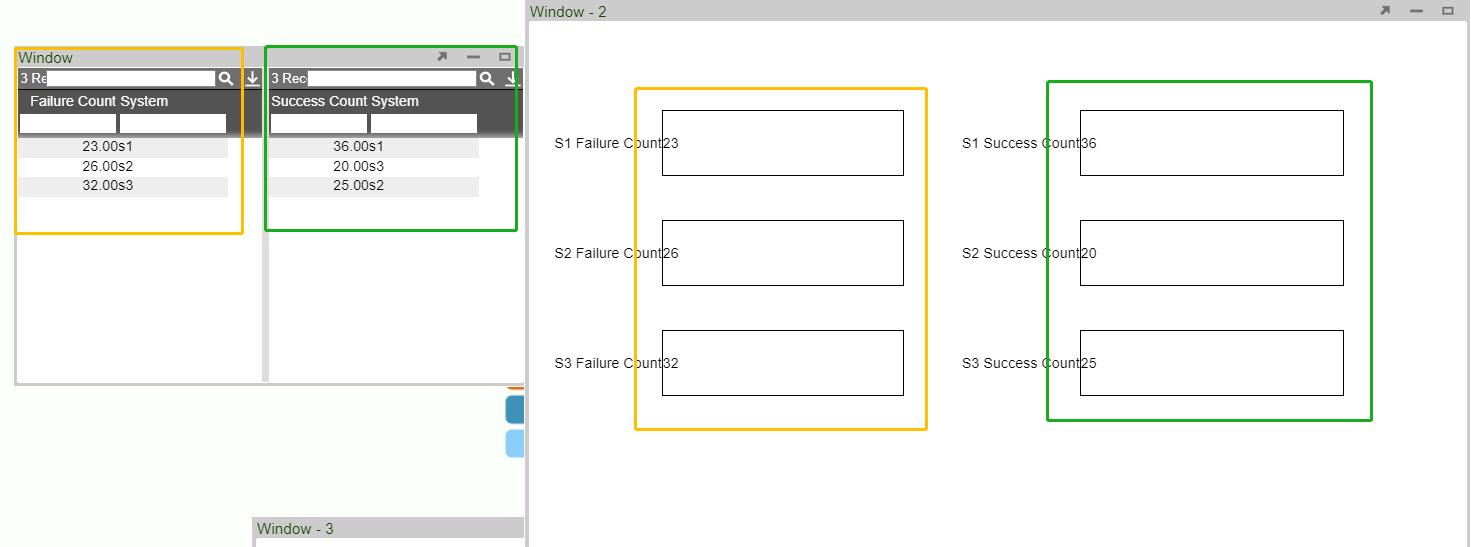
Real time Data model
We can have our data model subscribe to a real time feed to make it a real time data model.
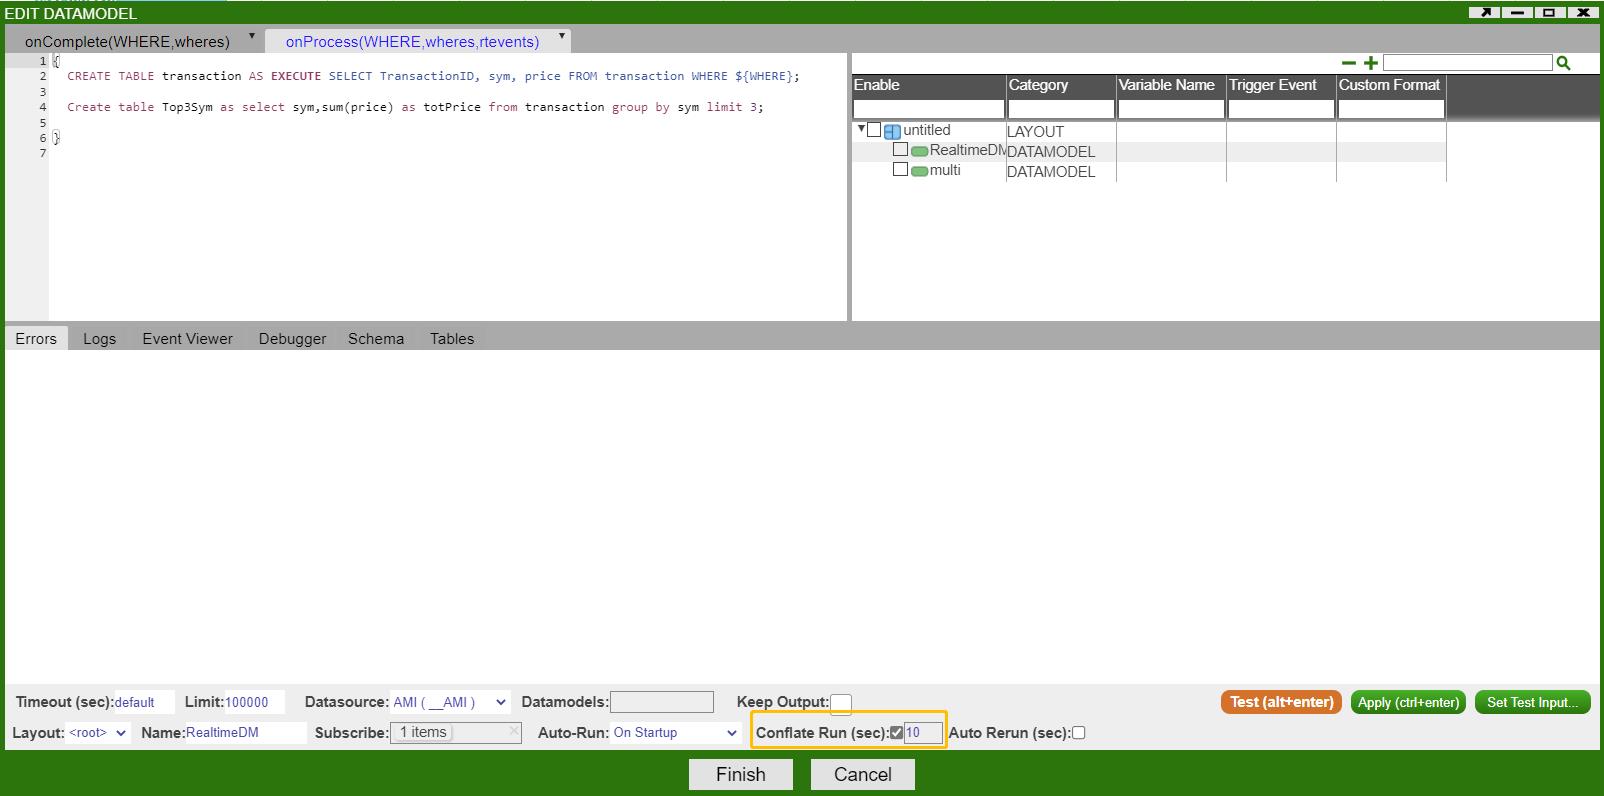
Let's say we have a real time feed transaction(TransactionID Long,sym String,price Double)
1. create a data model called realtimeDM and subscribe to real time feed transaction
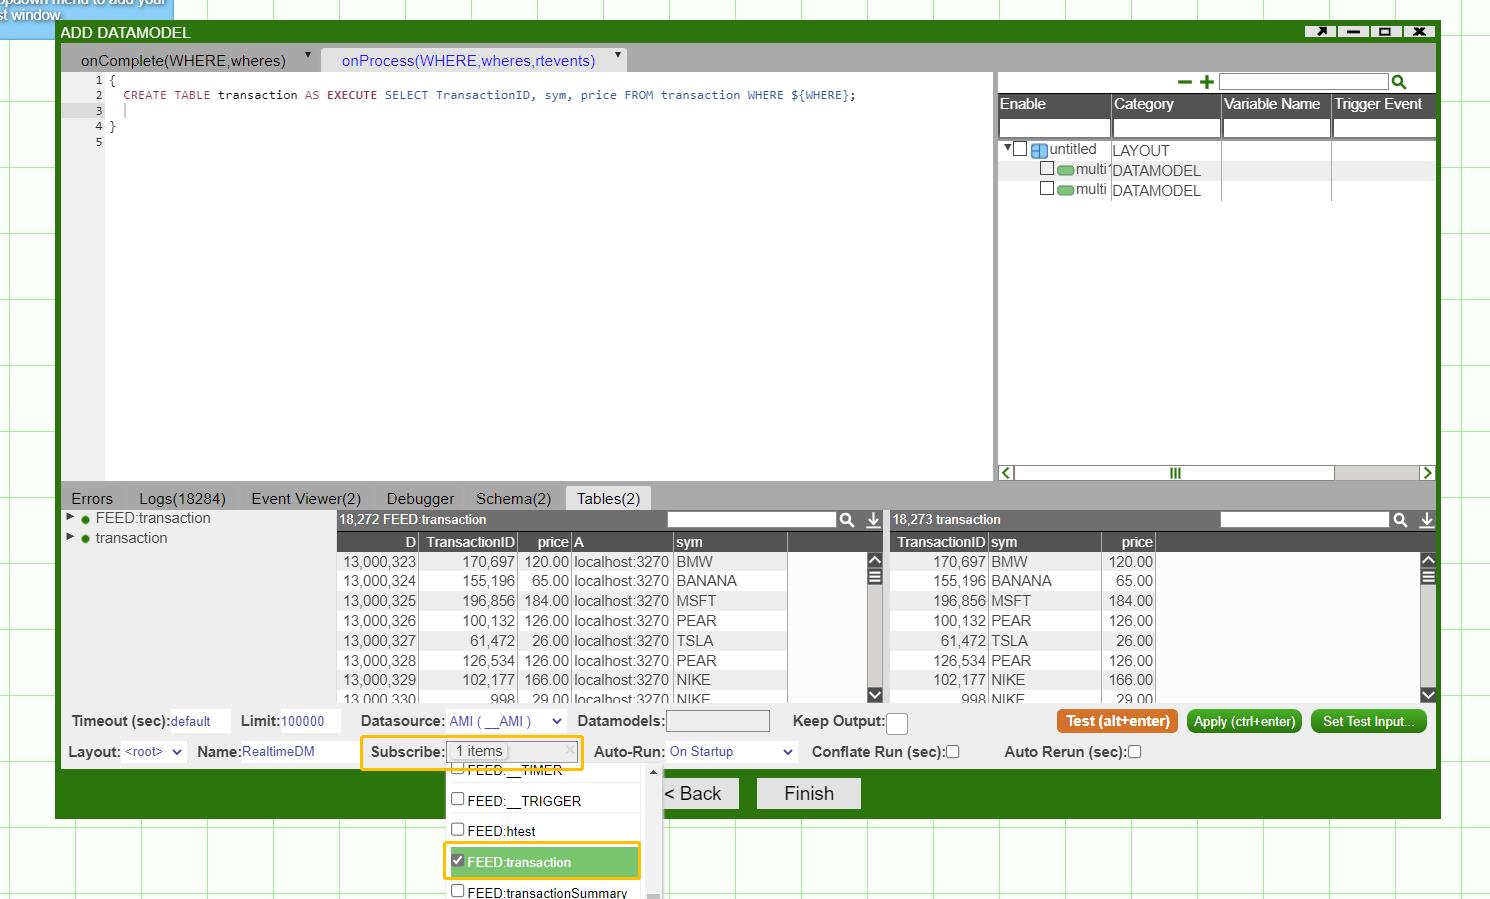
2. You could also configure queries to construct derived tables
In this example, we created another table showing the top3 symbol with the most total price.
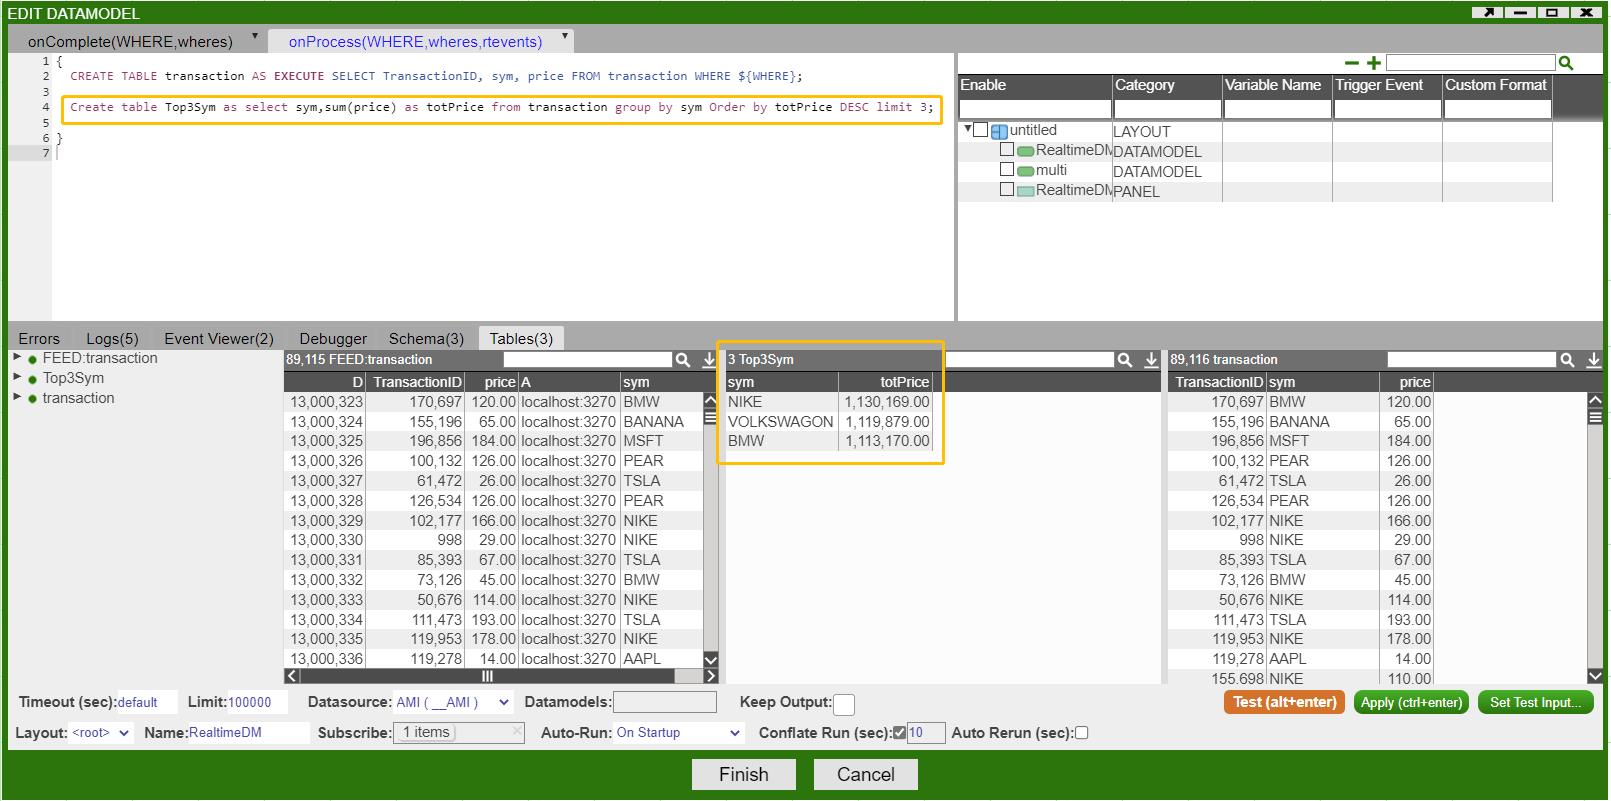
Additionally, you could also configure the conflate time parameter to control how frequently you want your data model to rerun and refresh.
In this example, it is set to 10 seconds, which means the data model will rerun 10 seconds per time.
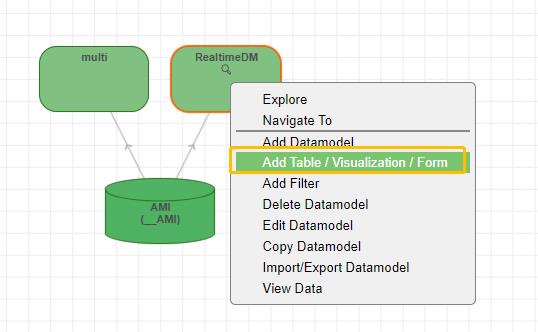
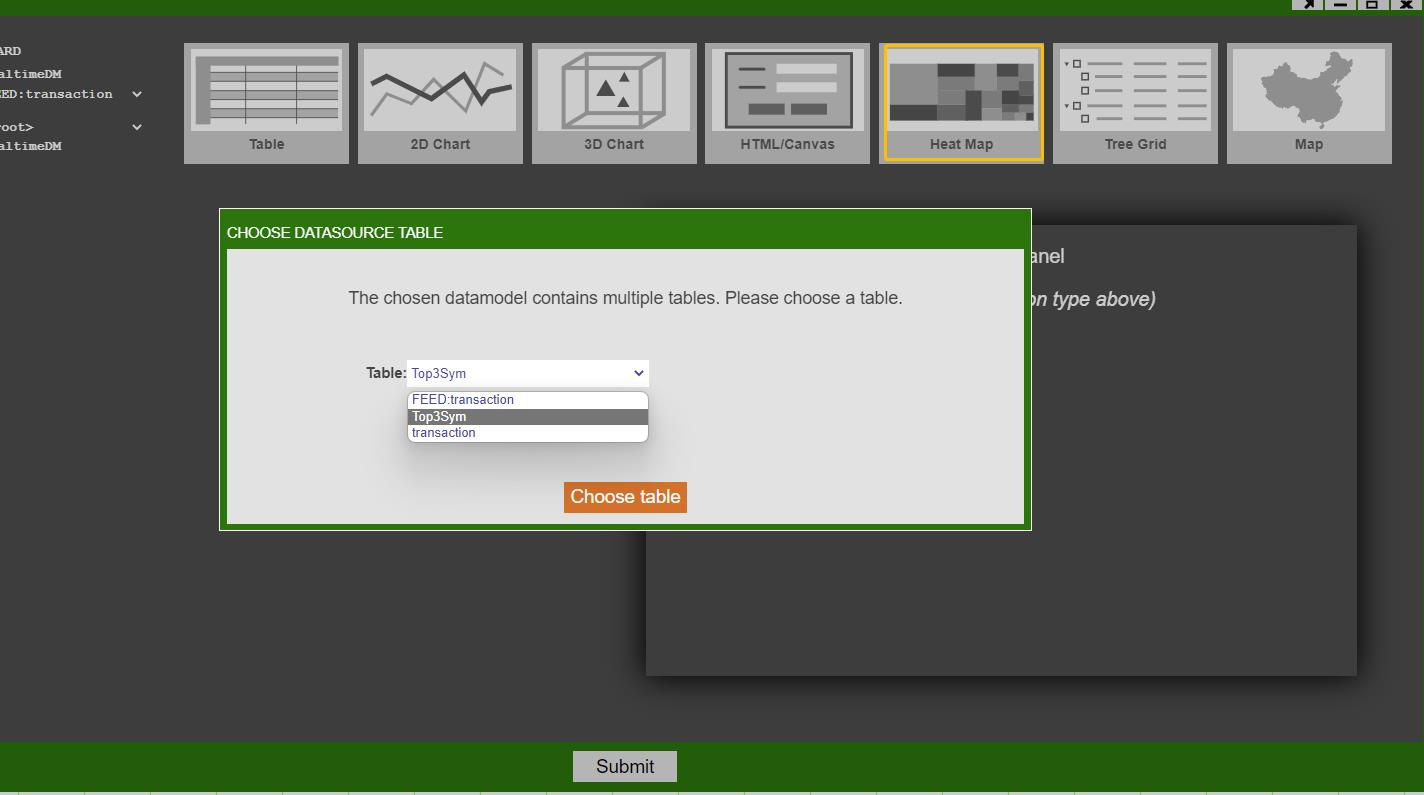
3. Create real time visualization panel off of the real time data model that we just created
In this example, we created a real time heatmap off of the top3sym table.
4. Final Heatmap
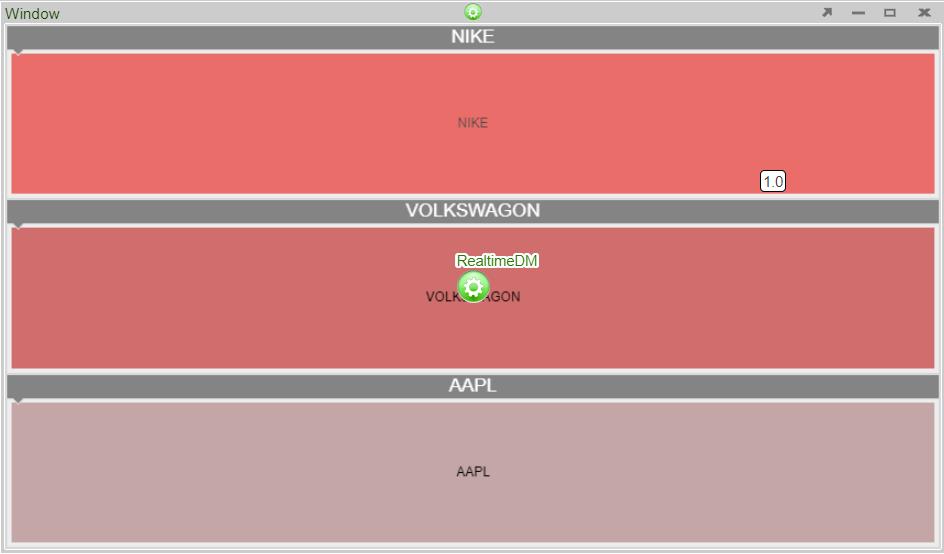
Note that you can press space on the heatmap to zoom in/out.
Import data model and panel configuration to AMI
1. Create a /myConfigs (can be any name you want) directory local to your AMI installation and put the configuration files (usually in the format of JSON) in it
The example below has the configuration file named CountryTemplate.json. You can have multiple configuration files

2. Read, Parse the config files and import the data model and panel to the AMI session
Also additionally, you can configure data model's WHERE variable.
The amiScript below show how to achieve these where each visualization panel has exactly one underlying data model:
filesystem fs=session.getFileSystem();
String Panelconfig = fs.readFile("myConfigs/testPanelConfig.json");
String DMconfig = fs.readFile("myConfigs/testDMConfig.json");
map Panelparsed = parseJson(Panelconfig);
map DMparsed = parseJson(DMconfig);
datamodel dm=session.importDatamodel(DMparsed);
map m = Panelparsed.jsonPath("portletConfigs.0.portletConfig.dm.0"); //get the id from the data model that we imported
m.put("dmadn", dm.getId()); //put the id above into the panel's configuration
dm.process(new map("WHERE", "Code=\"ABW\"")); // configure WHERE variable
session.importWindow("newWindow1", Panelparsed); //import the window
Progress Bar in Column Formatting
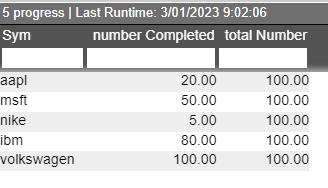
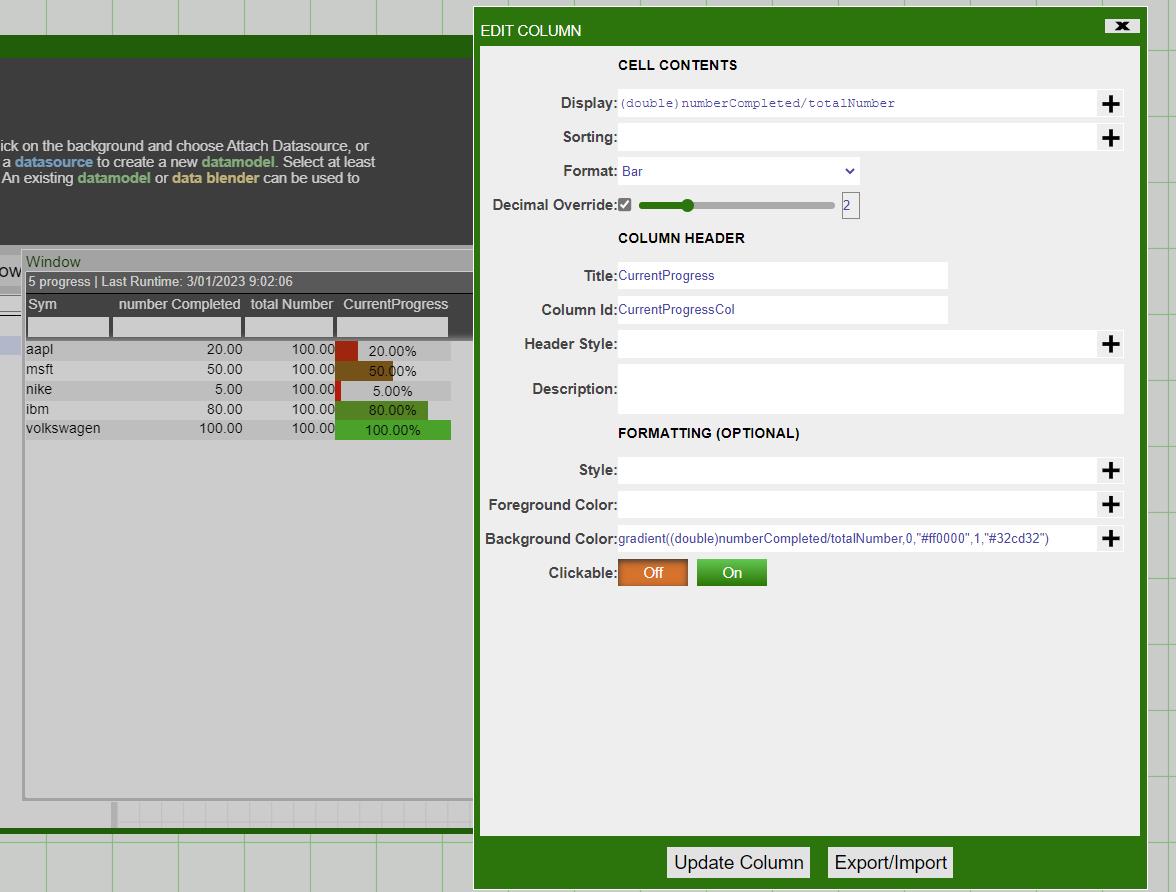
On the frontend table GUI, we can add and configure additional columns to make it look like a progress bar.
Suppose we have a GUI table progress like the following:
We can configure an additional column that displays the ratio of the number of Completed and the total number and shows the current progress
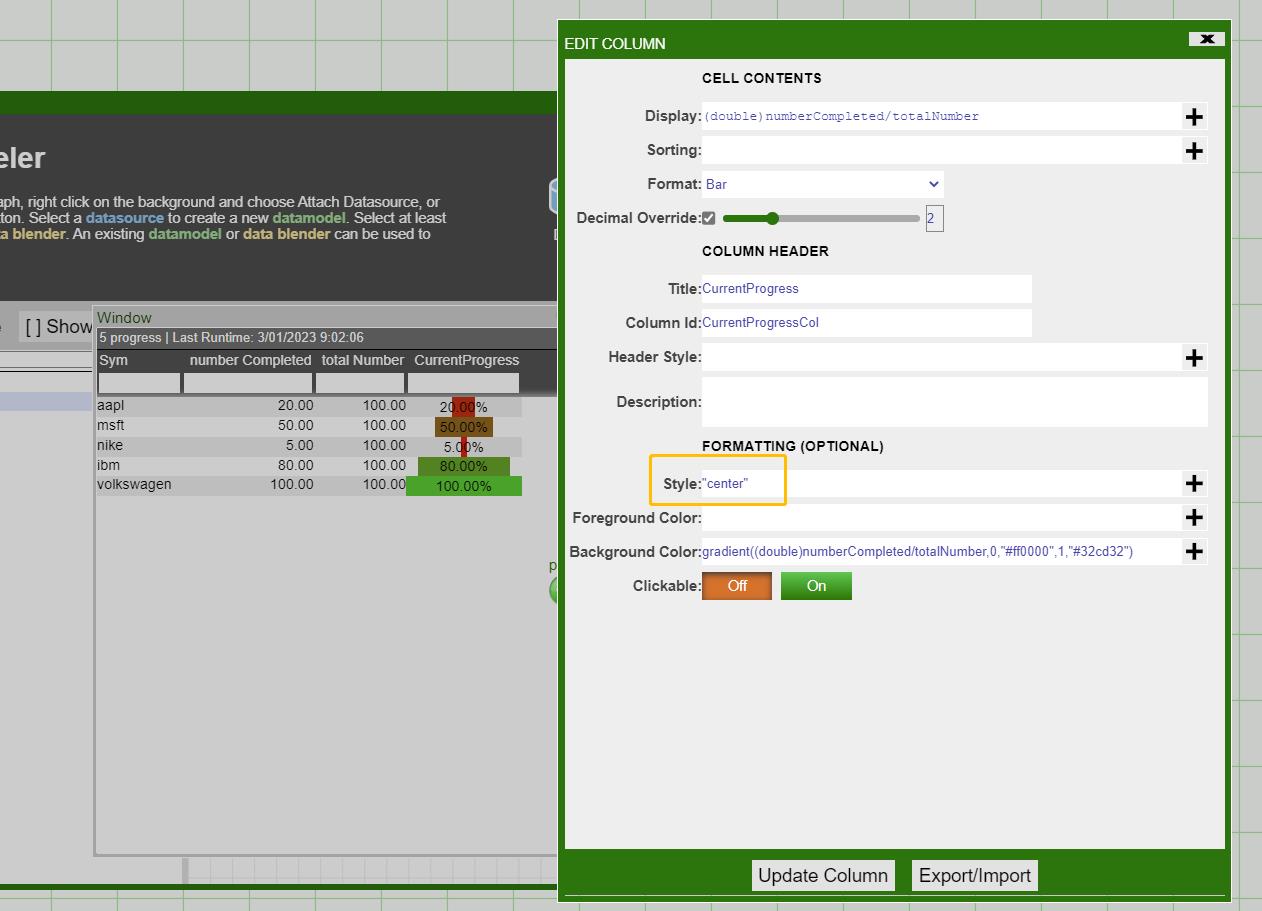
Additionally, we can also configure the style of the progress bar. For example:
Breadcrumb Filter Example
This is a basic example of a breadcrumb filter through the use of HTML and Javascript in a Form Div field.
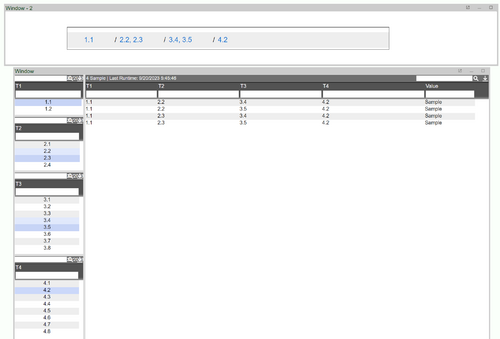
The layout follows the breadcrumb trail of tiers (T1 - T4) as filter levels. Most of the script can be found in the custom methods of the layout, and some in the onAmiJsCallback callback of the breadcrumb panel (for handling clicks to reset filters to indicated level/tier).
Layout:
{"layouts":[{"data":{"includeFiles":[],"metadata":{"amiScriptMethods":["{\n"," string getBreadCrumbStyle() {\n"," return \"<style>\n"," ul.breadcrumb {padding: 10px 10px;\n"," list-style: none;\n"," background-color: #eee;\n"," }\n"," ul.breadcrumb li {\n"," display: inline;\n"," font-size: 18px;\n"," }\n"," ul.breadcrumb li+li:before {\n"," padding: 8px;\n"," color: black;\n"," content: \\\"/\\\";\n"," }\n"," ul.breadcrumb li a {\n"," color: #0275d8;\n"," text-decoration: none;\n"," }\n"," ul.breadcrumb li a:hover {\n"," color: #01447e;\n"," text-decoration: underline;\n"," }\n"," </style>\";\n"," };\n"," \n"," boolean setFilter(){\n"," //get panels\n"," TablePanel tier1 = layout.getPanel(\"tier1\");\n"," TablePanel tier2 = layout.getPanel(\"tier2\");\n"," TablePanel tier3 = layout.getPanel(\"tier3\");\n"," TablePanel tier4 = layout.getPanel(\"tier4\");\n"," \n"," //build where clause for filtering & values for breadcrumbs\n"," string whereClause = \"\";\n"," string t1Vals = \"\";\n"," string t2Vals = \"\";\n"," string t3Vals = \"\";\n"," string t4Vals = \"\";\n"," if (tier1.getSelectedRows().size()!=0){\n"," row firstRow = tier1.getSelectedRows().get(0);\n"," string firstRowVal = firstRow.getValue(\"T1\");\n"," whereClause += \"T1 IN (\\\"${firstRowVal}\\\"\";\n"," t1Vals += firstRowVal;\n"," for (int i = 1; i < tier1.getSelectedRows().size(); ++i){\n"," row r = tier1.getSelectedRows().get(i);\n"," string rVal = r.getValue(\"T1\");\n"," whereClause += \",\\\"${rVal}\\\"\";\n"," t1Vals += \", ${rVal}\";\n"," }\n"," whereClause += \")\";\n"," }\n"," if (tier2.getSelectedRows().size()!=0){\n"," if (whereClause != \"\")\n"," whereClause += \" && \";\n"," row firstRow = tier2.getSelectedRows().get(0);\n"," string firstRowVal = firstRow.getValue(\"T2\");\n"," whereClause += \"T2 IN (\\\"${firstRowVal}\\\"\";\n"," t2Vals += firstRowVal;\n"," for (int i = 1; i < tier2.getSelectedRows().size(); ++i){\n"," row r = tier2.getSelectedRows().get(i);\n"," string rVal = r.getValue(\"T2\");\n"," whereClause += \",\\\"${rVal}\\\"\";\n"," t2Vals += \", ${rVal}\";\n"," }\n"," whereClause += \")\";\n"," }\n"," if (tier3.getSelectedRows().size()!=0){\n"," if (whereClause != \"\")\n"," whereClause += \" && \";\n"," row firstRow = tier3.getSelectedRows().get(0);\n"," string firstRowVal = firstRow.getValue(\"T3\");\n"," whereClause += \"T3 IN (\\\"${firstRowVal}\\\"\";\n"," t3Vals += firstRowVal;\n"," for (int i = 1; i < tier3.getSelectedRows().size(); ++i){\n"," row r = tier3.getSelectedRows().get(i);\n"," string rVal = r.getValue(\"T3\");\n"," whereClause += \",\\\"${rVal}\\\"\";\n"," t3Vals += \", ${rVal}\";\n"," }\n"," whereClause += \")\";\n"," }\n"," if (tier4.getSelectedRows().size()!=0){\n"," if (whereClause != \"\")\n"," whereClause += \" && \";\n"," row firstRow = tier4.getSelectedRows().get(0);\n"," string firstRowVal = firstRow.getValue(\"T4\");\n"," whereClause += \"T4 IN (\\\"${firstRowVal}\\\"\";\n"," t4Vals += firstRowVal;\n"," for (int i = 1; i < tier4.getSelectedRows().size(); ++i){\n"," row r = tier4.getSelectedRows().get(i);\n"," string rVal = r.getValue(\"T4\");\n"," whereClause += \",\\\"${rVal}\\\"\";\n"," t4Vals += \", ${rVal}\";\n"," }\n"," whereClause += \")\";\n"," }\n"," \n"," //apply where clause\n"," TablePanel mainTable = layout.getPanel(\"mainTable\");\n"," mainTable.setCurrentWhere(whereClause);\n"," \n"," //call breadcrumb builder\n"," t1Vals = t1Vals == \"\" ? \"All\" : t1Vals;\n"," t2Vals = t2Vals == \"\" ? \"All\" : t2Vals;\n"," t3Vals = t3Vals == \"\" ? \"All\" : t3Vals;\n"," t4Vals = t4Vals == \"\" ? \"All\" : t4Vals;\n"," map crumbValues = new map();\n"," crumbValues.put(\"t1\", t1Vals);\n"," crumbValues.put(\"t2\", t2Vals);\n"," crumbValues.put(\"t3\", t3Vals);\n"," crumbValues.put(\"t4\", t4Vals);\n"," buildBreadCrumb(crumbValues);\n"," \n"," return true;\n"," };\n"," \n"," boolean buildBreadCrumb(map crumbValues){\n"," String breadCrumb = getBreadCrumbStyle();\n"," breadCrumb += \"<body>\n"," <ul class=\\\"breadcrumb\\\">\";\n"," for (int i = 1; i < crumbValues.size() + 1; ++i){\n"," string crumbVal = crumbValues.get(\"t${i}\");\n"," if (crumbVal == \"All\"){\n"," boolean allBreak = true;\n"," for (int j = i; j < crumbValues.size() + 1; ++j){\n"," string allCheck = crumbValues.get(\"t${j}\");\n"," if (allCheck != \"All\")\n"," allBreak = false;\n"," }\n"," if (allBreak) \n"," break;\n"," }\n"," breadCrumb += \"<li><a onclick='amiJsCallback(this,${i}, 0);'>${crumbVal}</a></li>\";\n"," }\n"," breadCrumb += \"</ul>\n"," </body>\";\n"," \n"," FormPanel breadCrumbPnl = layout.getPanel(\"breadcrumbPnl\");\n"," FormDivField breadcrumbDiv = breadCrumbPnl.getField(\"breadcrumbDiv\");\n"," breadcrumbDiv.setValue(breadCrumb);\n"," };\n","}"],"customPrefsImportMode":"reject","dm":{"dms":[{"callbacks":{"entries":[{"amiscript":["{\n"," CREATE TABLE Sample(T1 String, T2 String, T3 String, T4 String, value string);\n"," \n"," for (int i1=0; i1<2; ++i1){\n"," string t1 = \"1.${i1+1}\";\n"," for (int i2=0; i2<4; ++i2){\n"," string t2 = \"2.${i2+1}\";\n"," for (int i3=0; i3<8; ++i3){\n"," string t3 = \"3.${i3+1}\";\n"," for (int i4=0; i4<8; ++i4){\n"," string t4 = \"4.${i4+1}\";\n"," insert into Sample values (t1, t2, t3, t4, \"Sample\");\n"," }\n"," }\n"," }\n"," }\n","}\n"],"hasDatamodel":true,"linkedVariables":[],"name":"onProcess","schema":{"tbl":[{"cols":[{"nm":"T1","tp":"String"},{"nm":"T2","tp":"String"},{"nm":"T3","tp":"String"},{"nm":"T4","tp":"String"},{"nm":"value","tp":"String"}],"nm":"Sample","oc":"ask"}]}}]},"lbl":"mainTable","lm":0,"lower":[],"queryMode":"startup","test_input_type":"OPEN","test_input_vars":"String WHERE=\"true\";","to":0},{"callbacks":{"entries":[{"amiscript":["{\n"," CREATE TABLE Tier1 AS SELECT T1 FROM Sample WHERE ${WHERE} group by T1;\n","}"],"hasDatamodel":true,"inputDm":["mainTable"],"linkedVariables":[],"name":"onProcess","schema":{"tbl":[{"cols":[{"nm":"T1","tp":"String"},{"nm":"T2","tp":"String"},{"nm":"T3","tp":"String"},{"nm":"T4","tp":"String"},{"nm":"value","tp":"String"}],"nm":"Sample","oc":"ask"},{"cols":[{"nm":"T1","tp":"String"}],"nm":"Tier1","oc":"ask"}]}}]},"lbl":"tier1","lm":0,"lower":["mainTable"],"test_input_type":"OPEN","test_input_vars":"String WHERE=\"true\";","to":0},{"callbacks":{"entries":[{"amiscript":["{\n"," CREATE TABLE Tier2 AS SELECT T2 FROM Sample WHERE ${WHERE} group by T2;\n","}\n"],"hasDatamodel":true,"inputDm":["mainTable"],"linkedVariables":[],"name":"onProcess","schema":{"tbl":[{"cols":[{"nm":"T1","tp":"String"},{"nm":"T2","tp":"String"},{"nm":"T3","tp":"String"},{"nm":"T4","tp":"String"},{"nm":"value","tp":"String"}],"nm":"Sample","oc":"ask"},{"cols":[{"nm":"T2","tp":"String"}],"nm":"Tier2","oc":"ask"}]}}]},"lbl":"tier2","lm":0,"lower":["mainTable"],"test_input_type":"OPEN","test_input_vars":"String WHERE=\"true\";","to":0},{"callbacks":{"entries":[{"amiscript":["{\n"," CREATE TABLE Tier3 AS SELECT T3 FROM Sample WHERE ${WHERE} group by T3;\n","}\n"],"hasDatamodel":true,"inputDm":["mainTable"],"linkedVariables":[],"name":"onProcess","schema":{"tbl":[{"cols":[{"nm":"T1","tp":"String"},{"nm":"T2","tp":"String"},{"nm":"T3","tp":"String"},{"nm":"T4","tp":"String"},{"nm":"value","tp":"String"}],"nm":"Sample","oc":"ask"},{"cols":[{"nm":"T3","tp":"String"}],"nm":"Tier3","oc":"ask"}]}}]},"lbl":"tier3","lm":0,"lower":["mainTable"],"test_input_type":"OPEN","test_input_vars":"String WHERE=\"true\";","to":0},{"callbacks":{"entries":[{"amiscript":["{\n"," CREATE TABLE Tier4 AS SELECT T4 FROM Sample WHERE ${WHERE} group by T4;\n","}\n"],"hasDatamodel":true,"inputDm":["mainTable"],"linkedVariables":[],"name":"onProcess","schema":{"tbl":[{"cols":[{"nm":"T1","tp":"String"},{"nm":"T2","tp":"String"},{"nm":"T3","tp":"String"},{"nm":"T4","tp":"String"},{"nm":"value","tp":"String"}],"nm":"Sample","oc":"ask"},{"cols":[{"nm":"T4","tp":"String"}],"nm":"Tier4","oc":"ask"}]}}]},"lbl":"tier4","lm":0,"lower":["mainTable"],"test_input_type":"OPEN","test_input_vars":"String WHERE=\"true\";","to":0}]},"fileVersion":3,"rt":{"processors":[]},"stm":{"styles":[{"id":"LAYOUT_DEFAULT","lb":"Layout Default","pt":"DEFAULT"}]}},"portletConfigs":[{"portletBuilderId":"amidesktop","portletConfig":{"active":"Div1","amiPanelId":"@DESKTOP","amiStyle":{"pt":"LAYOUT_DEFAULT"},"windows":[{"header":true,"height":697,"hidden":false,"left":582,"portlet":"Div1","pos":0,"state":"flt","title":"Window","top":442,"width":1235,"zindex":2},{"header":true,"height":137,"hidden":false,"left":558,"portlet":"breadcrumbPnl","pos":1,"state":"flt","title":"Window - 2","top":277,"width":1280,"zindex":1}]}},{"portletBuilderId":"div","portletConfig":{"amiPanelId":"Div1","amiStyle":{"pt":"LAYOUT_DEFAULT","vl":{"div":{"divAlign":"start"}}},"child1":"Div2","child2":"mainTable","dir":"v","isMin":false,"offset":0.14736842105263157,"upid":"Div1"}},{"portletBuilderId":"div","portletConfig":{"amiPanelId":"Div2","amiStyle":{"pt":"LAYOUT_DEFAULT"},"child1":"tier1","child2":"Div3","dir":"h","isMin":false,"offset":0.15460992907801419,"upid":"Div2"}},{"portletBuilderId":"div","portletConfig":{"amiPanelId":"Div3","amiStyle":{"pt":"LAYOUT_DEFAULT"},"child1":"tier2","child2":"Div4","dir":"h","isMin":false,"offset":0.24283305227655985,"upid":"Div3"}},{"portletBuilderId":"div","portletConfig":{"amiPanelId":"Div4","amiStyle":{"pt":"LAYOUT_DEFAULT"},"child1":"tier3","child2":"tier4","dir":"h","isMin":false,"offset":0.48654708520179374,"upid":"Div4"}},{"portletBuilderId":"amiform","portletConfig":{"amiPanelId":"breadcrumbPnl","amiStyle":{"pt":"LAYOUT_DEFAULT"},"amiTitle":"","buttons":[],"callbacks":{"entries":[{"amiscript":["int selected = action;\n","int totalTiers = 4;\n","\n","for (int i = selected + 1; i < totalTiers + 1; ++i){\n"," TablePanel tierPanel = layout.getPanel(\"tier${i}\");\n"," tierPanel.selectRows(false);\n","}"],"linkedVariables":[],"name":"onAmiJsCallback"}]},"dm":[],"fields":[{"callbacks":{},"disabled":false,"dme":"","heightPx":59,"help":"","hidden":true,"l":"breadcrumbDiv","labelHidden":true,"leftPosPx":160,"n":"breadcrumbDiv","style":"","t":"divField","template":"","topPosPx":40,"widthPx":840,"zidx":1}],"guides":[],"htmlTemplate2":null,"snap":20,"titlePnl":{"title":""},"upid":"breadcrumbPnl"}},{"portletBuilderId":"amistatictable","portletConfig":{"amiCols":[{"fm":"T1","id":"T1","location":0,"tl":"T1","tp":"text","width":188},{"fm":"T2","id":"T2","location":1,"tl":"T2","tp":"text","width":214},{"fm":"T3","id":"T3","location":2,"tl":"T3","tp":"text","width":215},{"fm":"T4","id":"T4","location":3,"tl":"T4","tp":"text","width":268},{"fm":"value","id":"value","location":4,"tl":"Value","tp":"text","width":130},{"id":"D","width":100}],"amiPanelId":"mainTable","amiStyle":{"pt":"LAYOUT_DEFAULT"},"amiTitle":"Sample","curtimeUpdateFrequency":1000,"dm":[{"dmadn":"mainTable","dmtbid":["Sample"]}],"dynamicColumns":"false","editDblClk":true,"editInplace":false,"editMenuTitle":"Edit Row(s)","editMode":0,"editRerunDM":true,"filters":{},"pinCnt":0,"rollupEnabled":false,"scrollToBottomOnAppend":false,"showCommandMenu":true,"showLastRuntime":true,"titlePnl":{"title":"Sample"},"upid":"mainTable","varTypes":{"T1":"String","T2":"String","T3":"String","T4":"String","value":"String"}}},{"portletBuilderId":"amistatictable","portletConfig":{"amiCols":[{"ei":"","eof":"","fm":"T1","id":"T1","location":0,"sy":"\"center\"","tl":"T1","tp":"text","width":174},{"id":"D","width":100}],"amiPanelId":"tier1","amiStyle":{"pt":"LAYOUT_DEFAULT"},"amiTitle":"Tier1","callbacks":{"entries":[{"amiscript":"setFilter();","linkedVariables":[],"name":"onSelected"}]},"curtimeUpdateFrequency":1000,"dm":[{"dmadn":"tier1","dmtbid":["Tier1"]}],"dynamicColumns":"false","editDblClk":true,"editInplace":false,"editMenuTitle":"Edit Row(s)","editMode":0,"editRerunDM":true,"filters":{},"pinCnt":0,"rollupEnabled":false,"scrollToBottomOnAppend":false,"showCommandMenu":true,"showLastRuntime":true,"titlePnl":{"title":"Tier1"},"upid":"tier1","varTypes":{"T1":"String"}}},{"portletBuilderId":"amistatictable","portletConfig":{"amiCols":[{"ei":"","eof":"","fm":"T2","id":"T2","location":0,"sy":"\"center\"","tl":"T2","tp":"text","width":169},{"id":"D","width":100}],"amiPanelId":"tier2","amiStyle":{"pt":"LAYOUT_DEFAULT"},"amiTitle":"Tier2","callbacks":{"entries":[{"amiscript":"setFilter();","linkedVariables":[],"name":"onSelected"}]},"curtimeUpdateFrequency":1000,"dm":[{"dmadn":"tier2","dmtbid":["Tier2"]}],"dynamicColumns":"false","editDblClk":true,"editInplace":false,"editMenuTitle":"Edit Row(s)","editMode":0,"editRerunDM":true,"filters":{},"pinCnt":0,"rollupEnabled":false,"scrollToBottomOnAppend":false,"showCommandMenu":true,"showLastRuntime":true,"titlePnl":{"title":"Tier2"},"upid":"tier2","varTypes":{"T2":"String"}}},{"portletBuilderId":"amistatictable","portletConfig":{"amiCols":[{"ei":"","eof":"","fm":"T3","id":"T3","location":0,"sy":"\"center\"","tl":"T3","tp":"text","width":168},{"id":"D","width":100}],"amiPanelId":"tier3","amiStyle":{"pt":"LAYOUT_DEFAULT"},"amiTitle":"Tier3","callbacks":{"entries":[{"amiscript":"setFilter();","linkedVariables":[],"name":"onSelected"}]},"curtimeUpdateFrequency":1000,"dm":[{"dmadn":"tier3","dmtbid":["Tier3"]}],"dynamicColumns":"false","editDblClk":true,"editInplace":false,"editMenuTitle":"Edit Row(s)","editMode":0,"editRerunDM":true,"filters":{},"pinCnt":0,"rollupEnabled":false,"scrollToBottomOnAppend":false,"showCommandMenu":true,"showLastRuntime":true,"titlePnl":{"title":"Tier3"},"upid":"tier3","varTypes":{"T3":"String"}}},{"portletBuilderId":"amistatictable","portletConfig":{"amiCols":[{"ei":"","eof":"","fm":"T4","id":"T4","location":0,"sy":"\"center\"","tl":"T4","tp":"text","width":167},{"id":"D","width":100}],"amiPanelId":"tier4","amiStyle":{"pt":"LAYOUT_DEFAULT"},"amiTitle":"Tier4","callbacks":{"entries":[{"amiscript":"setFilter();","linkedVariables":[],"name":"onSelected"}]},"curtimeUpdateFrequency":1000,"dm":[{"dmadn":"tier4","dmtbid":["Tier4"]}],"dynamicColumns":"false","editDblClk":true,"editInplace":false,"editMenuTitle":"Edit Row(s)","editMode":0,"editRerunDM":true,"filters":{},"pinCnt":0,"rollupEnabled":false,"scrollToBottomOnAppend":false,"showCommandMenu":true,"showLastRuntime":true,"titlePnl":{"title":"Tier4"},"upid":"tier4","varTypes":{"T4":"String"}}}]},"location":"breadcrumbs.ami","type":"ABSOLUTE"}],"rootLayout":{"location":"breadcrumbs.ami","type":"ABSOLUTE"}}
Sending emails from AMI
Below is an minimal example setup for setting up email in the properties file (local.properties):
email.client.host=smtp.office365.com

email.client.port=587

email.client.username=demo@outlook.com

email.client.password=samplePassword
Change the host and port properties accordingly (gmail, outlook, etc).
More email configuration properties can be found here: 3forge_Email_Configuration_Properties
Layout Setup
There are two methods in amiscript for sending emails:
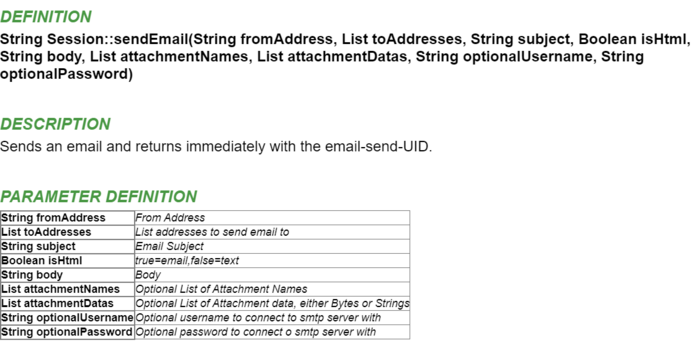
sendEmail (sends an email and returns immediately with the email-send-UID)

sendEmailSync (sends an email and returns with the email result)
List of supported attachment file formats
- Application:
- atom
- json
- jar
- js
- ogg, ogv
- ps
- woff
- xhtml, xht, xml
- dtd
- zip
- gz
- xlsx
- Audio:
- au, snd
- mid, rmi
- mp3
- aif, aifc, aiff
- m3u
- ra, ram
- wav
- Image:
- bmp
- cod
- gif
- ief
- jpe, jpeg, jpg
- jfif
- png
- svg
- tif, tiff
- ras
- cmx
- ico
- pnm
- pbm
- pgm
- ppm
- rgb
- xbm
- xpm
- xwd
- Message:
- mht, mhtml, nws
- Text:
- css
- 323
- htm, html, stm
- uls
- bas, c, h, txt, ami
- rtx
- sct
- tsv
- htt
- htc
- etc
- vcf
- Video:
- mp2, mpa, mpe, mpeg, mpg, mpv2
- mov, qt
- lsf, lsx
- asf, asr, asx
- avi
- movie
- X-world:
- flr, vrml, wrl, wrz, xaf, xof
Here's some guidance on how to troubleshoot the following SSL-related issues, such as No available authentication scheme,Unsupported or unrecognized SSL message,or SSL Protocol Error
In our experience these issues are not caused by 3forge AMI but are generic error messages indicating that there was a problem in how the certificate was generated.
Here is our recommended procedure for the generation:
1) Download the root keystore for your environment (Should not matter if using jks or pem)
keytool -importkeystore -srckeystore cacerts.jks -destkeystore web.keystore
Or
keytool -import -file cacert.pem -keystore web.keystore
2) Generate Certificate Signing Request (CSR) - Modifies keystore * keypass and storepass should match https.keystore.password, source password is the cacerts password
keytool -genkeypair -keystore web.keystore -alias server -keyalg RSA -keysize 2048 -sigalg SHA256withRSA -dname "CN=...,OU=...,O=C=..."
3) Through your Certificate Authority (CA) create a Certificate Request -> Certificate Type, MS CA WebServer to generate a Certificate
4) Import the certificate into the keystore
keytool -import -v -trustcacerts -alias root -keystore web.keystore -file cert.cer -keypass [pass] -storepass [pass]
4b) In our experience the following command didn't work and was the cause of the above SSL-related errors
keytool -importcert -keystore web.keystore -alias server -file cert.cer
Memory Overload
Overview
There are several places in AMI from where memory consumption info can be collected. Then a few steps can be taken to optimize the consumption.
How do we know if AMI is facing performance issues?
1.1 The AMI Data Statistics bar will turn red indicating AMI slowdown
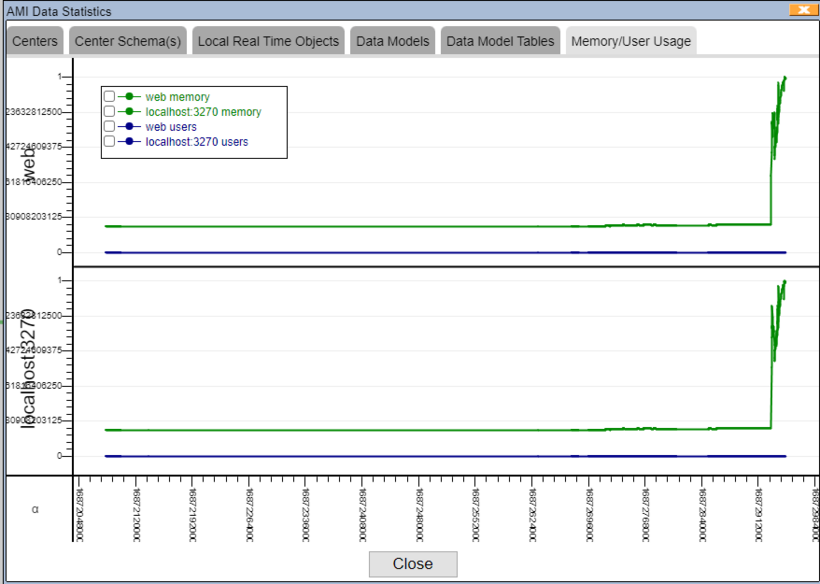
1.2 Chart irregularity in the AMI Data Statistics Window
1. Upper Graph - memory footprint of the webserver
2. Bottom Graph - memory footprint of the center
3. This graph is designed so that the top of the graph is the maximum memory capacity. If the line gets near the top, AMI is closer to memory overload.
1.3 AMI Log Viewer
Setup of Log Viewer can be found in 3forge documentation -> Guides#Log_Viewer_Layout
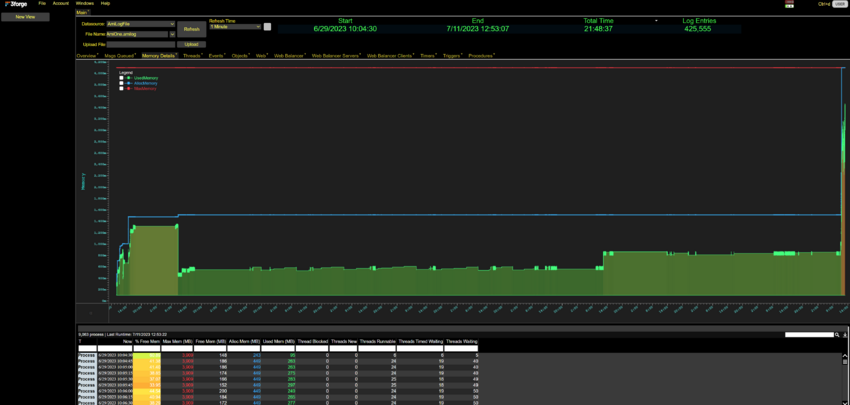
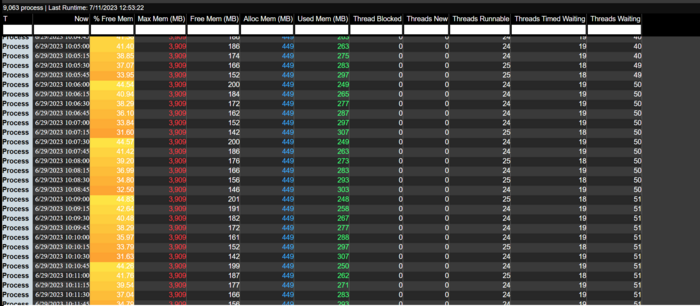
- Upload the file AMIOne.amilog in the filename bar and open the Memory Details tab
1. The red line is the maximum memory capacity of AMI. If the Used Memory and Allocated Memory reaches to the max, it suggests AMI will face performance issues.
2. The table in the panel below gives insightful details of the AMI like
- Percentage of free memory
- Values of maximum, allocated, and used memory.
3. We can use these values to better understand how much memory AMI used up and would need to let go.
Troubleshooting
Data lives both in the webserver and the center. The most important step is to identify where the memory issue lies.
Web Server
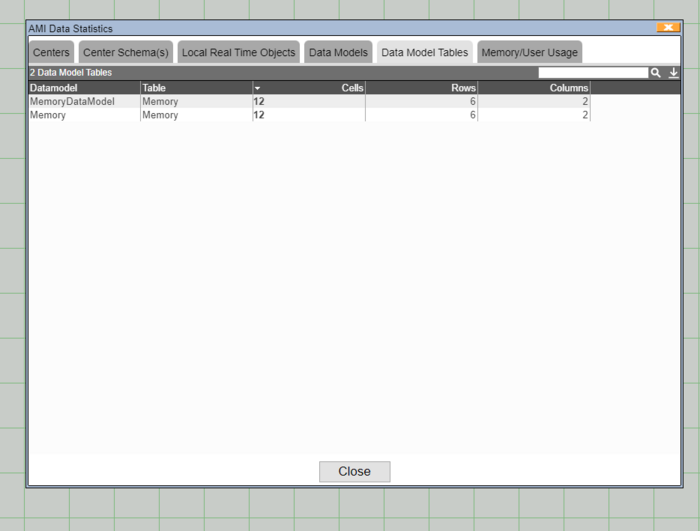
1. Open the Data Model Tables tab from the AMI Data Statistics Window in the upper right corner of AMI
This tab contains information of the tables created in the current webserver the user is in.
- The Cells column should be looked at as it shows which table has the most data.
- You can also view the count of rows and columns.
Looking at the count of cells, we can recognize the most populated table from the web server to modify.
SOLUTION - Dropping a Table from the Web Server
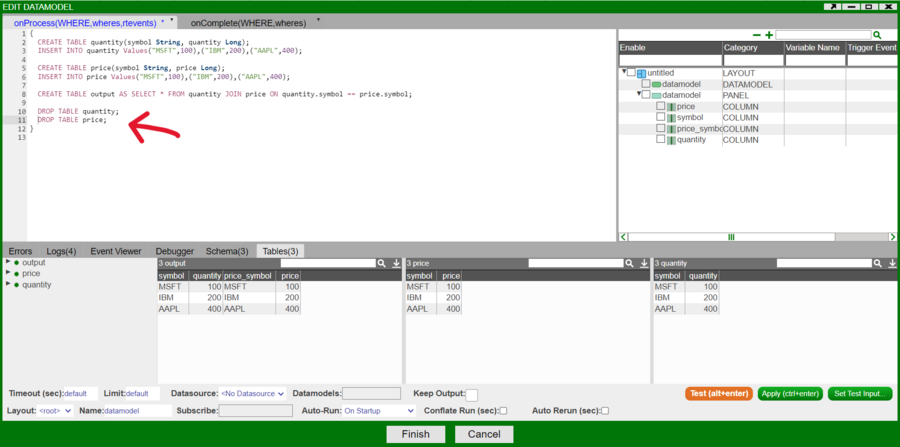
Data models often use intermediary tables which aren't used in any visualizations. These tables can be dropped at the end of the data model to reduce memory footprint.
- In this example, the tables that are joined (price,quantity) are no longer needed in the data model as the joined table output will be used for visualizations.
- Hence, tables price and quantity can be dropped.
Center
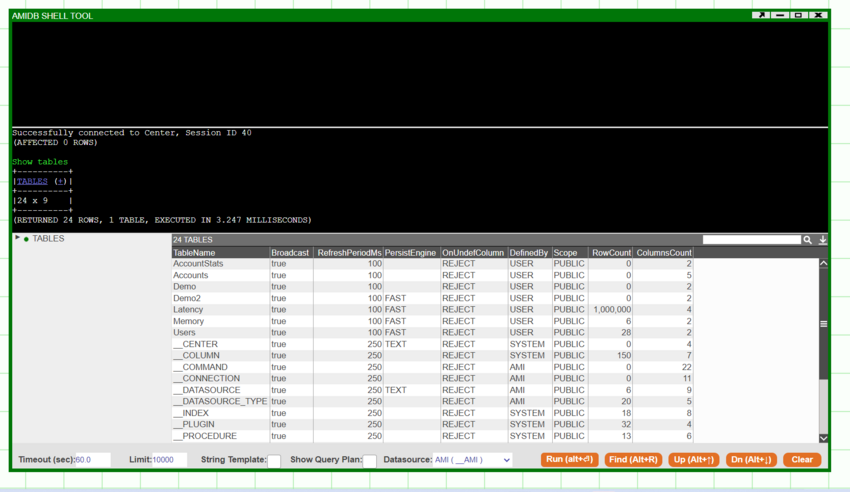
1. Open the AMI DB Shell Tool from Dashboard
We can view all the tables in the center through the command line by writing
SHOW TABLES;
We can view the row count of every table and find the most populated table in order to reduce memory footprint.
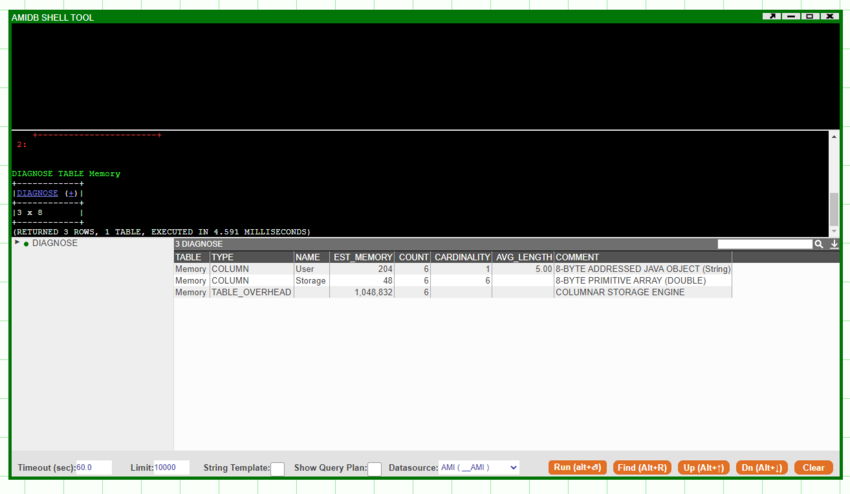
2. Diagnose a Table
For deeper analysis, we can diagnose a table through the AMI shell tool by writing
DIAGNOSE TABLE table_name;
The DIAGNOSE table will show all the necessary information about each column related to memory consumption (ignore TABLE_OVERHEAD)
- EST_MEMORY shows the memory for each column.
- COMMENT shows the datatypes and the byte size of each column.
SOLUTION - Datatype Conversion
If a string column exists in the table, it is recommended for the column to be stored as a STRING BITMAP or STRING ONDISK to reduce the high memory usage of a regular string column.
More info on efficient column types for a string can be found in our 3forge documentation -> AMI_Realtime_Database#Choosing_the_Best_Column_Type_for_String
If data type conversion cannot be done then dropping a table from the center would be the last option.
Logviewer layout
Here is a layout that reads AMI log files, including AmiOne.log, AmiOne.amilog, to show diagnostic information on AMI's memory usage, timers/triggers/procedures/query performance and more.
Instructions:
1. download and load this layout via File -> Import (copy and paste the text) OR File -> Upload (file)
2. Go to Dashboard -> Data Modeler
3. Right click and select Add Datasource, choose Flat File Reader
4. the Name has to be AmiLogFile exactly, and give the path to a directory that contains the log files. You can use absolute path or relative path (relative to AMI's root directory)
5. Click Update Datasource. If successful, it will tell you the number of tables, or files in this case, in the directory.
Using AmiOne.amilog file to see overall diagnostics on AMI:
1. In the top left corner, click on the down arrow as seen in the screenshot below. In the drop down, select the .amilog file that you wish to use.
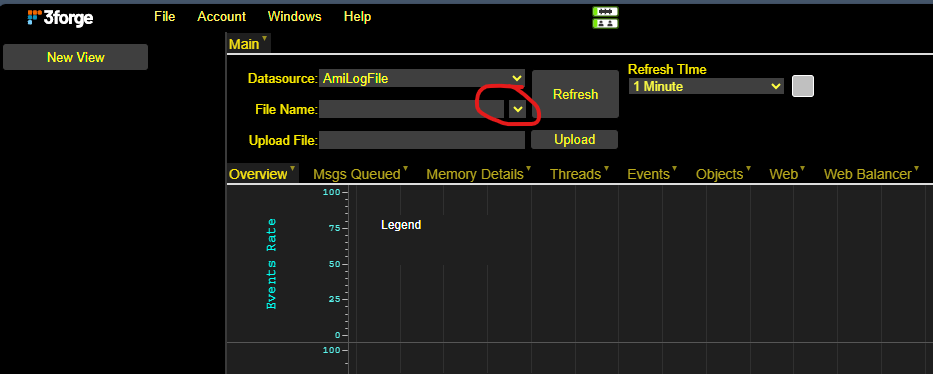
2. Feel free to switch between tabs to see different information. You can also adjust the size of the plot/legend by dragging the edge out.
Using AmiOne.log file to view query performance on AMI:
1. Go to Windows -> AmiQueriesPerformance
2. type in the file name that ends in .log, e.g. AmiOne.log
3. Click on Run Analytics on the right side of the field.
4. Go to the Performance Charts tab.
5. You can change the Legends' grouping in the top left panel; filter the chart dots with the bottom left panel. Feel free to sort the table on the bottom panel to suit your needs.
