Guides
Source Control Management
Key Features
Source Control Management (SCM) Integration & Tooling
Integration with GIT and Perforce. Conveniently check-in/out, diff history within the AMI web-based dashboard builder.
Multi-file Linker
Dashboards can be comprised of multiple files meaning components can be logically separated for independent management/version control.
Abstraction
Functionality can be marked virtual and overridden in another file, allowing for dashboard designers to abstract out functionality for custom implementation.
Refactoring Tool
Components can safely be renamed and/or moved between files. The tool automatically updates and moves dependencies as necessary with naming conflict resolution.
Dashboard File Stabilization
Changes to a dashboard result in minimum/localized changes to the underlying file. Components can be set to defaults to avoid noisy/unintended changes.
Benefits
Team Collaboration
By logically dividing a dashboard across files, Teams can simultaneously work on sub-components of the dashboard.
Reusable Components
Scripts, datamodels, widgets and entire dashboards can be written once and then reused across dashboards.
Dashboard Tracking, Versioning, Branching
As AMI files are managed by source control, they can be used to label versions of a dashboard, compare versions and manage branching.
Merging Independent Projects
Existing dashboards can be incorporated into new dashboards making it easy to build super-dashboards cross-incorporating functionality
Enterprise Deployment Strategy
Treat AMI files just like any other resources that are managed through deployment strategies, such as uDeploy, TeamCity, etc.
Dashboard Extension
Extend existing dashboards for regional/business line specific usage without needing to maintain multiple near duplicate dashboards.
Full Backwards Compatibility
File
Loads existing dashboards and automatically converts to the new format. Note: files are still json with the same general structure, just less clutter/redundancy.
Usage
Users & dashboard developers can continue to develop/maintain dashboards without change. Changes are purely additive, existing functionality has not been changed nor removed.
Split Dashboards
Split existing dashboards into separate files for better SCM management.
Combine Dashboards
Utilize multiple existing dashboards to create a single super-dashboard.
Key Concepts
Dashboards vs. Layout
Prior to Source Control Management (SCM), a Dashboard was backed by a single Layout file, so the terms were interchangeable. With SCM, a Dashboard can be an amalgamation of multiple Layout files so the distinction matters:
- Layout: an individual .ami file which contains a set of source definitions such as Panels, Datamodels, Relationships, AmiScript, etc.
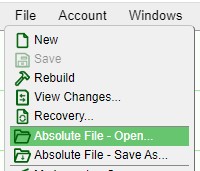
- Dashboard (Root Layout): the .ami file that is directly opened (ex: File > Absolute File - Open) is considered a Dashboard, or more specifically the Root Layout
Included Layouts
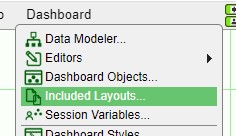
A layout file can also include pointers to other .ami Layout FIles (Dashboard > Included Layouts). This forms a Parent Layout/Child Layout Relationship.
Hidden Panels
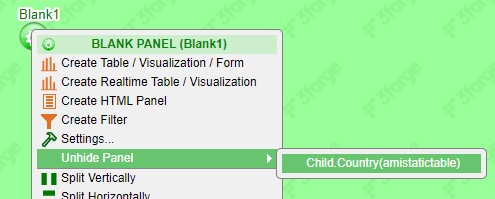
A layout file can define panels that are not directly referenced in the dashboard. If a layout includes a child layout, all of the child layout's panels are hidden by default. In order to make a child layout's panel(s) visible, you need to specifically unhide it (Blank Window > Green Button > Unhide Panel). In effect, this is how linking a panel from one layout to another is achieved.
Getting Started
Please ensure this property is set before continuing: ami.scm.plugins=com.f1.ami.plugins.git.AmiGitScmPlugin
Connecting to Source Control Management (SCM)
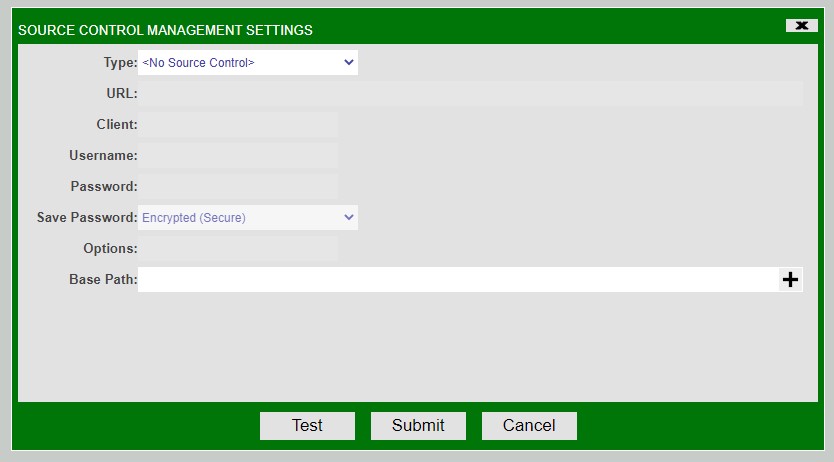
Navigate to Account > Source Control Settings, select the appropriate source control type and fill in your user credentials. The base path tells AMI where it expects files to reside which are managed under source control, including sub directories. (files outside that directory will not have source control functionality)
Loading/Saving Dashboards in SCM
Traditionally, layouts could only be stored under “my layouts” or “cloud”. Now there is an “Absolute” (File > Absolute File - Open) option which allows you to load/save files anywhere on the host. If you wish to use SCM to manage a layout file, it should be located under the SCM base path (Account > Source Control Settings > Base Path). Tip: To move a layout from my layouts into SCM, simply load it (File > My Layouts - Open) and then save it under said SCM base path (File > Absolute File - Save As).
Link multiple files to a dashboard
Open the project browser (Dashboard > Include Files)
To add an existing file:
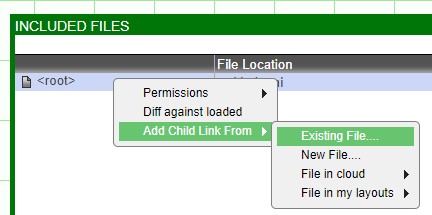
Right click on the project > Add Child Link from > Existing File > select the file to add.
To add a new file:
Right click on the project > Add Child Link From > New File > Enter the name of the new, blank file to create.
Notes:
- The alias defines how objects (panels, datamodels, etc.) within this will be referenced within the main dashboard.
- Read-only: If selected then, you will not be able to save changes made to the objects within the selected file.
- Relative Path: If true, then the file will be referenced using a path relative to the parent file; otherwise it will be an absolute path. Relative is preferred for portability.
Link to a panel from another file
Be sure the other file has been included (see Link Multiple files to a dashboard). Create a blank Panel (Window > New Window), click the blank panel’s green button > unhide panel > choose the panel to display
Refactoring
To Move a panel (and it’s dependent objects) from one file to another, click on the panels green button > Move to Different Layout > select the layout to move the panel to.
Using Source Control
- Open the project Browser (Dashboard > Included Layouts), right click > Add Child Link From > Choose the appropriate action
- To see most recent changes : File > Diff against last save
Additions to Layout Editor
Hiding Panels
Panel's Green Button > Hide Highlighted Panels
Unhiding Panels
Windows > New Window > Green Button > Unhide Panel > Choose panel to unhide (Note, any blank panel can be used to link to a hidden panel
Tab Per Layout
Several Resource editor tools are now organized such that there is one editor panel per layout.
- Custom methods:
- Dashboard > Custom methods…
- Custom css
- Dashboard > Css…
- Custom callbacks
- Dashboard > Callbacks…
Owning Layout
All resources now have the concept of an owning layout:
- Variables:
- Adding/editing global variables now allows you to choose an owning layout (Dashboard > Variables Table… > Right Click > Add/Edit/Copy > Owning Layout)
- Relationships:
- Ability to choose which file owns the relationship (Green Button > Add/Edit Relationship > Owning Layout dropdown).
- Datamodels:
- Dashboard > Datamodeler… > Right Click on Datamodel > Config Tab > Owning Layout
- Panels:
- Green Button -> Move To Different Layout File -> Move To Layout
Data Modeler
There is a list of checkboxes on the left to choose which layout’s datamodels/panels to show (Dashboard -> Datamodeler)
Dashboard Objects
View for seeing all relationships (Dashboard > Dashboard Objects). Note: This was added to allow access to hidden relationships, which is a new concept. A relationship is hidden if its source or target panel’s are hidden.
Advanced Concepts
LAYOUT FILE
Previously an .ami json file was considered a fully-contained dashboard. Now, an .ami file should be thought of as a collection of resources such as panels, datamodels, code, etc. and can contain references to other .ami files. An individual .ami file is referred to as a layout. There are a few key points:
Root Layout
This is the file that was directly loaded (ex: File > Absolute File - Open) and is used as the “bootstrap” to determine which windows are loaded and displayed within the desktop.
Parent/Child Layout Relationship
A layout can include any number of child layouts such that each included layout must have a uniquely identifying alias. Note that the root Layout has no parent
Layout Alias
Each layout (.ami file) within the dashboard is uniquely identified using an alias (note that when you attach a child layout, you are prompted to choose a unique alias). This alias is used to reference objects within the layout.
Layout Nesting
Because layouts can recursively include other layouts, it’s possible to have child layouts, grandchild layouts, etc. In this case the alias is constructed by dotconcatenation, ex: a.b.c
Complex Nesting
Circular references are not supported (ex; A.ami -> B.ami -> A.ami). Diamond references are supported (A.ami -> B.ami -> C.ami & A.ami -> D.ami -> C.ami).
Read-only/Locked
A layout file can be marked as read-only (Dashboard > Included Layouts > (right click) > Permissions). If the same file is referenced multiple times (as with the diamond pattern) then only one instance will be editable, and the others will be locked.
ALIAS-DOT-NAME (ADN)
Previously, all panels where identified by a unique panel ID. Now, uniqueness is enforced by combining a panel’s owning layout’s fully qualified alias plus the Panel Id. Same goes for uniquely identifying datamodels and relationships.
SCOPING
Parent layouts have access to the resources of child layouts but child layouts do not have visibility to parent objects. This is an important concept that enforces clean modularization.
CUSTOM AMISCRIPT METHODS & VARIABLE SCOPING
Because a dashboard can incorporate multiple layout files, it’s possible for the same method definition to exist in duplicate. Depending on where the AmiScript is getting executed, the appropriate version of the method will be run. For example, a parent layout could import two child layouts, each with their own onButton() method. Datamodels (or other resources) in child1 calling onButton() will get child1’s method and Datamodels in child2 calling onButton() will get child2’s version of the method. A subtle detail, if the parent layout did not define its own onButton() method and were to call onButton(), it will get the child with the higher priorities version… (See Dashboard > Included Layouts > (right click) > Move Up Higher Priority/Move Down Lower Priority)
AMISCRIPT LAYOUT OBJECT
A new, important Layout class has been introduced, which is used to represent each layout file loaded within the dashboard. The layout variable is automatically visible within AmiScript (like the session variable) and is associated with the layout that the AmiScript is owned by. This is important because it maintains relative consistency when referencing other objects with AmiScript. Note, this has replaced several methods from the session class and when loading old layouts AMI will automatically convert the code to use the layout object instead.
For example, let’s consider a layout B.ami that has two datamodels dm1 and dm2:
B.ami
→dm1
→dm2
Inside dm1, if we want to get access to dm2 we would write:
//I’m inside dm1 Datamodel dm2=layout.getDatamodel(“dm2”);
Say that we have another layout A.ami that includes B.ami with the alias b and has its own datamodel dm0:
A.ami
→dm0
→b
→dm1
→dm2
First, keep in mind the above code will continue to work because its inside dm1 which is owned by layout b so the layout instant represents b. But now, let’s say we want to get dm2 from code inside dm0. We could do either of these:
//I’m inside dm0, all three of these result in same value
Datamodel dm2;
dm2=layout.getChild(“b”).
getDatamodel(“dm2”);
dm2=layout.getDatamodel(“b.dm2”);
dm2=layout.getDatamodel(“b.dm1”).
getLayout().getDatamodel(“dm2”);
The 3rd method is needlessly complex but highlights the relative nature of layouts and resources… We’re grabbing b’s dm1 datamodel. Then because dm1 and dm2 are in the same layout we can simply do getLayout(). getDatamodel(“dm2”) on dm1.
VIRTUAL METHODS
With regards to scoping, it was mentioned that AmiScript within a child layout does not have access to it’s parent’s AmiScript. While generally true, if the layout were to explicitly define a function as virtual and the parent layout were to also define the same method, then the parent’s function will get called instead. In the example below, if we were to call doit() in the child layout, we would see the alerts parent1 and child2 because test1() was marked as virtual, but test2 was not:
Child Layout:
virtual String test1() {
     session.alert(“child1”);
}
String test2() {
     session.alert(“child2”);
}
Object doit() {
     test1();
     test2();
}
Root Layout:
String test1() {
     session.alert(“parent1”);
}
String test2() {
     session.alert(“parent2”);
}
Connecting to an Excel Datasource
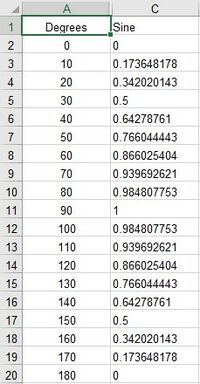
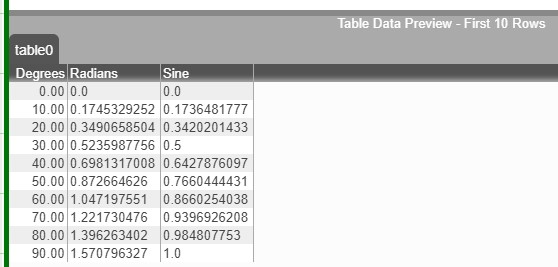
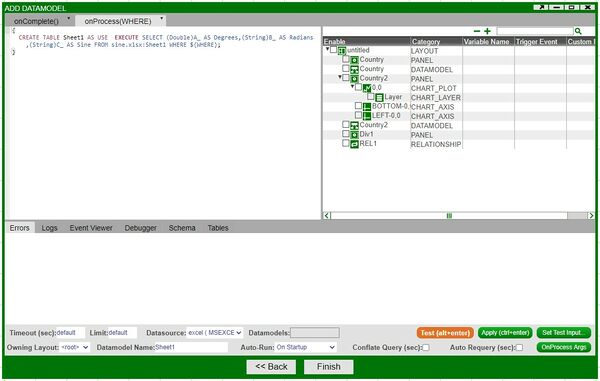
Our goal in this tutorial is to import excel data into AMI and create a visualization. In this example we have an Excel spreadsheet, sine.xlsx, with two columns: Degrees and Sine.
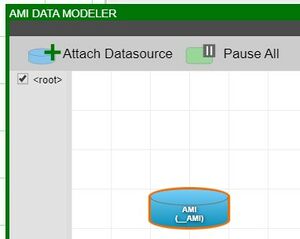
1. The first step is to add a new Excel Datasource. In developer mode, click on Dashboard from the menu and open the Data Modeler.
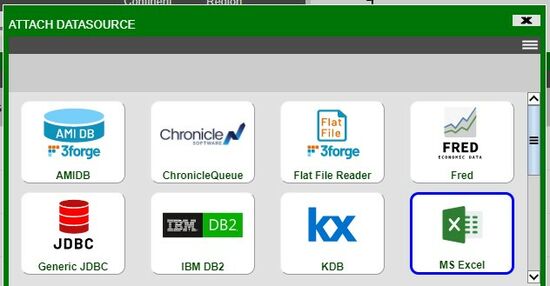
2. Inside the Data Modeler, click on Attach Datasource. This will bring up the Attach Datasource Window. Select the MS Excel icon from the list of available datasource types.
3. In the provided fields, fill out the Name and URL fields. In the Name field, put in the desired name of the new datasource. And in the URL field, provide the full file name (including the path) of the Excel file.
(Warning: prior to adding as a datasource, the Excel file must be closed and saved)
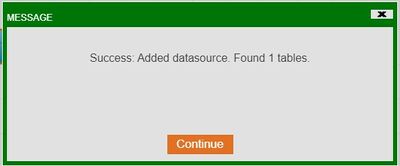
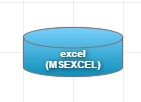
4. The successful addition of the MS Excel datasource will be confirmed with a prompt and the appearance of the Excel datasource in the Data Modeler
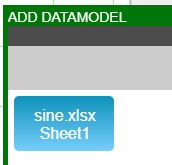
(Note: each sheet in the Excel file will be added as a table to the datasource)
5. Double click on the datasource (or right-click and select Add Datamodel to excel) in order to see the tables under the datasource. Select the table and follow the wizard in order to create a datamodel
(Note: you may also preview the data in the bottom half of the window in order to ensure you are working with the correct data)
6. Once the datamodel is created, we can create a visualization. In this example, we will create a line chart. In the wizard, select the appropriate variables for the X and Y axis (i.e, X: degree, Y: sine)
